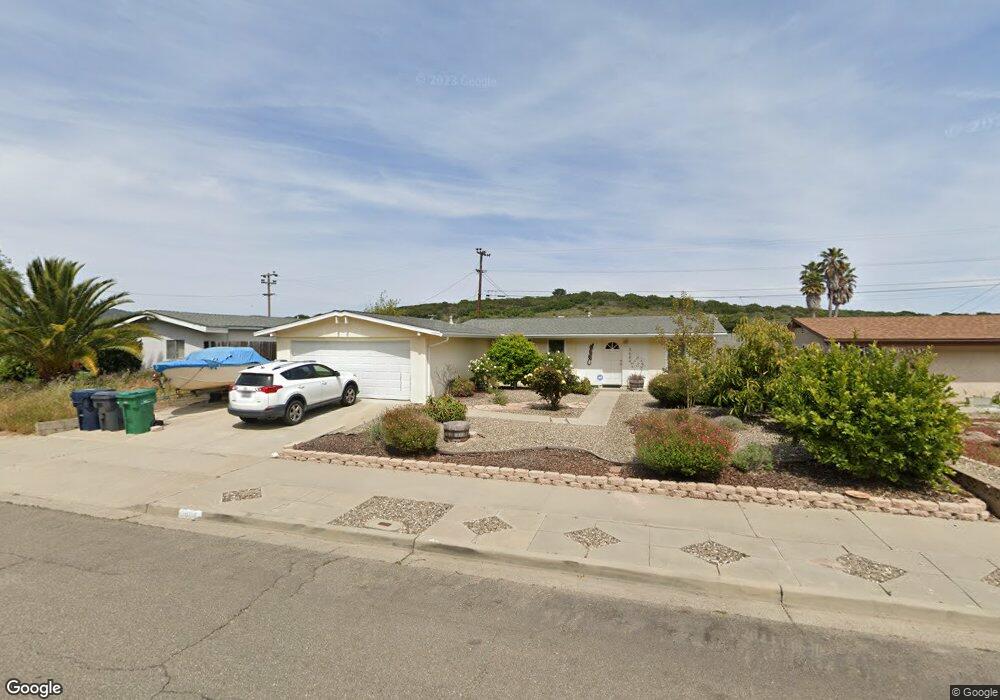
3684 Via Semi Lompoc, CA 93436
Mission Hills NeighborhoodEstimated Value: $518,345 - $585,000
3
Beds
2
Baths
1,080
Sq Ft
$508/Sq Ft
Est. Value
About This Home
This home is located at 3684 Via Semi, Lompoc, CA 93436 and is currently estimated at $548,336, approximately $507 per square foot. 3684 Via Semi is a home located in Santa Barbara County with nearby schools including Los Berros Visual and Performing Arts Academy, Cabrillo High School, and Olive Grove Charter - Lompoc.
Ownership History
Date
Name
Owned For
Owner Type
Purchase Details
Closed on
Dec 5, 2018
Sold by
Schenck Lloyd T and Schenck Susanne I
Bought by
Schenck Lloyd T and Schenck Susanne I
Current Estimated Value
Purchase Details
Closed on
Jun 9, 2000
Sold by
Arriola Alfred W
Bought by
Schenck Lloyd T and Schenck Susanne I
Home Financials for this Owner
Home Financials are based on the most recent Mortgage that was taken out on this home.
Original Mortgage
$113,060
Outstanding Balance
$40,794
Interest Rate
8.55%
Estimated Equity
$507,542
Purchase Details
Closed on
Feb 11, 2000
Sold by
Arriola Alfred W
Bought by
Arriola Alfred W
Home Financials for this Owner
Home Financials are based on the most recent Mortgage that was taken out on this home.
Original Mortgage
$84,000
Interest Rate
8.27%
Create a Home Valuation Report for This Property
The Home Valuation Report is an in-depth analysis detailing your home's value as well as a comparison with similar homes in the area
Home Values in the Area
Average Home Value in this Area
Purchase History
| Date | Buyer | Sale Price | Title Company |
|---|---|---|---|
| Schenck Lloyd T | -- | None Available | |
| Schenck Lloyd T | $119,000 | First American Title Co | |
| Arriola Alfred W | -- | Fidelity National Title Co | |
| Arriola Alfred W | -- | Fidelity National Title Co |
Source: Public Records
Mortgage History
| Date | Status | Borrower | Loan Amount |
|---|---|---|---|
| Open | Schenck Lloyd T | $113,060 | |
| Previous Owner | Arriola Alfred W | $84,000 |
Source: Public Records
Tax History
| Year | Tax Paid | Tax Assessment Tax Assessment Total Assessment is a certain percentage of the fair market value that is determined by local assessors to be the total taxable value of land and additions on the property. | Land | Improvement |
|---|---|---|---|---|
| 2025 | $1,977 | $189,835 | $90,399 | $99,436 |
| 2023 | $1,977 | $182,466 | $86,890 | $95,576 |
| 2022 | $1,941 | $178,889 | $85,187 | $93,702 |
| 2021 | $1,962 | $175,382 | $83,517 | $91,865 |
| 2020 | $1,939 | $173,585 | $82,661 | $90,924 |
| 2019 | $1,907 | $170,183 | $81,041 | $89,142 |
| 2018 | $1,876 | $166,847 | $79,452 | $87,395 |
| 2017 | $1,841 | $163,577 | $77,895 | $85,682 |
| 2016 | $1,806 | $160,370 | $76,368 | $84,002 |
| 2014 | $1,765 | $154,869 | $73,748 | $81,121 |
Source: Public Records
Map
Nearby Homes
- 3578 Via Lato
- 3770 Rucker Rd
- 3838 Via Mitad
- 1445 Calle Marana
- 1588 Calle Portos
- 972 Pellham Dr
- 892 Onstott Rd
- 832 Onstott Rd
- 372 Falcon Crest Dr
- 757 Onstott Rd
- 384 Falcon Crest Dr
- 778 Tamarisk Dr
- 2655 Adobe Falls Rd
- 250 Saint Andrews Way
- 4166 Oakwood Ct
- 4173 Oakwood Ct
- 649 Burning Tree Way
- 549 Palomar Cir
- 3825 Saturn Ave Unit 1
- 3725 Jupiter Ave
Your Personal Tour Guide
Ask me questions while you tour the home.