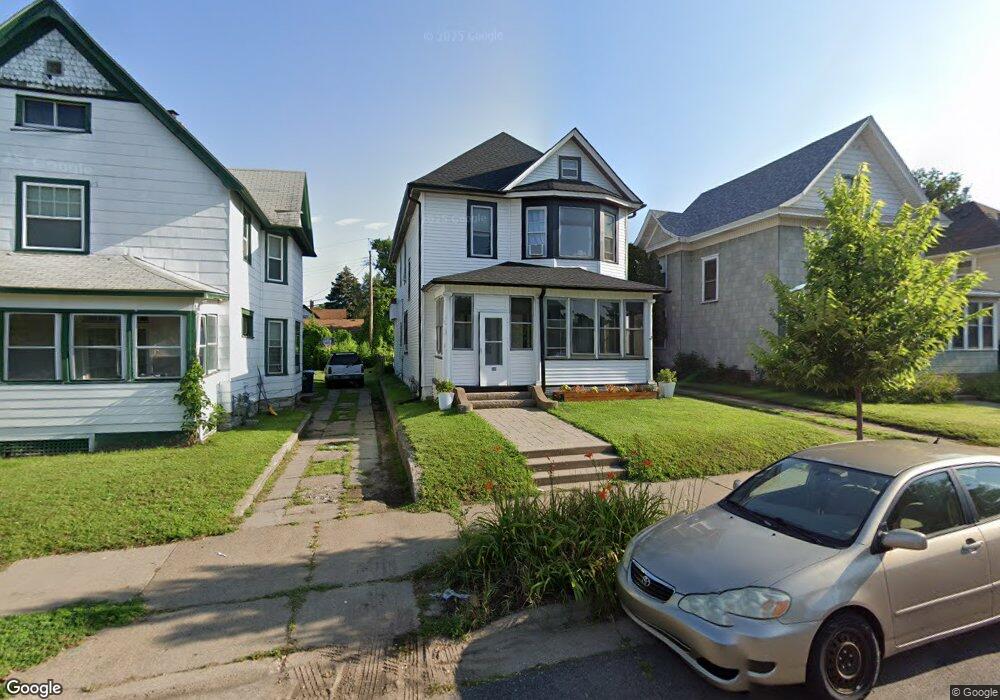
369 Case Ave Saint Paul, MN 55130
Payne-Phalen NeighborhoodEstimated Value: $237,147 - $272,000
2
Beds
1
Bath
3,147
Sq Ft
$80/Sq Ft
Est. Value
About This Home
This home is located at 369 Case Ave, Saint Paul, MN 55130 and is currently estimated at $253,287, approximately $80 per square foot. 369 Case Ave is a home located in Ramsey County with nearby schools including Bruce F Vento Elementary School, Washington Technology Magnet School, and Community Of Peace Academy.
Ownership History
Date
Name
Owned For
Owner Type
Purchase Details
Closed on
Nov 3, 2020
Sold by
Wilkins Mark H
Bought by
Bender Dara
Current Estimated Value
Home Financials for this Owner
Home Financials are based on the most recent Mortgage that was taken out on this home.
Original Mortgage
$187,150
Interest Rate
2.71%
Mortgage Type
New Conventional
Create a Home Valuation Report for This Property
The Home Valuation Report is an in-depth analysis detailing your home's value as well as a comparison with similar homes in the area
Home Values in the Area
Average Home Value in this Area
Purchase History
| Date | Buyer | Sale Price | Title Company |
|---|---|---|---|
| Bender Dara | $197,000 | None Available | |
| Bender Dara Dara | $197,000 | -- |
Source: Public Records
Mortgage History
| Date | Status | Borrower | Loan Amount |
|---|---|---|---|
| Previous Owner | Bender Dara | $187,150 | |
| Closed | Bender Dara Dara | $187,150 |
Source: Public Records
Tax History
| Year | Tax Paid | Tax Assessment Tax Assessment Total Assessment is a certain percentage of the fair market value that is determined by local assessors to be the total taxable value of land and additions on the property. | Land | Improvement |
|---|---|---|---|---|
| 2025 | $4,348 | $266,000 | $25,000 | $241,000 |
| 2023 | $4,348 | $217,900 | $20,000 | $197,900 |
| 2022 | $2,670 | $203,100 | $20,000 | $183,100 |
| 2021 | $2,090 | $175,000 | $20,000 | $155,000 |
| 2020 | $1,624 | $145,700 | $7,400 | $138,300 |
| 2019 | $1,560 | $112,100 | $7,400 | $104,700 |
| 2018 | $1,376 | $107,200 | $7,400 | $99,800 |
| 2017 | $1,298 | $100,000 | $7,400 | $92,600 |
| 2016 | $1,112 | $0 | $0 | $0 |
| 2015 | $1,006 | $87,800 | $7,400 | $80,400 |
| 2014 | $906 | $0 | $0 | $0 |
Source: Public Records
Map
Nearby Homes
Your Personal Tour Guide
Ask me questions while you tour the home.