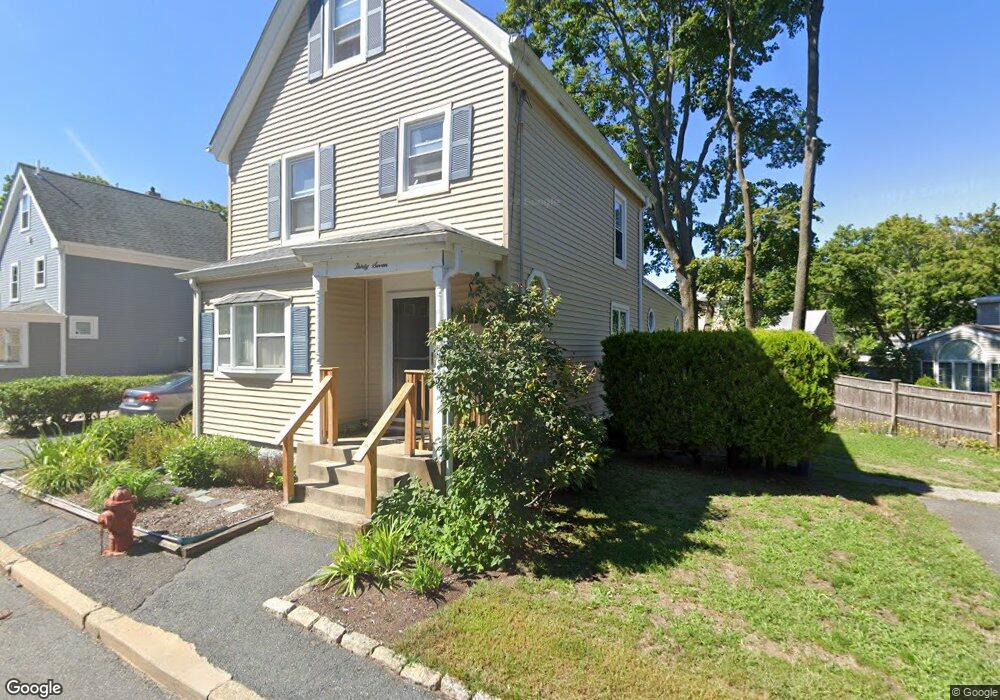
37 Alden Place West Newton, MA 02465
West Newton NeighborhoodEstimated Value: $961,000 - $1,181,000
2
Beds
1
Bath
1,614
Sq Ft
$659/Sq Ft
Est. Value
About This Home
This home is located at 37 Alden Place, West Newton, MA 02465 and is currently estimated at $1,063,407, approximately $658 per square foot. 37 Alden Place is a home located in Middlesex County with nearby schools including C.C. Burr, Franklin Elementary School, and F.A. Day Middle School.
Ownership History
Date
Name
Owned For
Owner Type
Purchase Details
Closed on
Aug 27, 1999
Sold by
Falcone Angelo J and Falcone Josephine C
Bought by
Gooley Michael P and Gooley Toby
Current Estimated Value
Home Financials for this Owner
Home Financials are based on the most recent Mortgage that was taken out on this home.
Original Mortgage
$240,000
Outstanding Balance
$69,568
Interest Rate
7.53%
Mortgage Type
Purchase Money Mortgage
Estimated Equity
$993,839
Create a Home Valuation Report for This Property
The Home Valuation Report is an in-depth analysis detailing your home's value as well as a comparison with similar homes in the area
Home Values in the Area
Average Home Value in this Area
Purchase History
| Date | Buyer | Sale Price | Title Company |
|---|---|---|---|
| Gooley Michael P | $302,000 | -- |
Source: Public Records
Mortgage History
| Date | Status | Borrower | Loan Amount |
|---|---|---|---|
| Open | Gooley Michael P | $240,000 | |
| Previous Owner | Gooley Michael P | $30,000 |
Source: Public Records
Tax History Compared to Growth
Tax History
| Year | Tax Paid | Tax Assessment Tax Assessment Total Assessment is a certain percentage of the fair market value that is determined by local assessors to be the total taxable value of land and additions on the property. | Land | Improvement |
|---|---|---|---|---|
| 2025 | $7,577 | $773,200 | $741,400 | $31,800 |
| 2024 | $7,327 | $750,700 | $719,800 | $30,900 |
| 2023 | $6,865 | $674,400 | $540,100 | $134,300 |
| 2022 | $6,569 | $624,400 | $500,100 | $124,300 |
| 2021 | $6,339 | $589,100 | $471,800 | $117,300 |
| 2020 | $6,150 | $589,100 | $471,800 | $117,300 |
| 2019 | $5,976 | $571,900 | $458,100 | $113,800 |
| 2018 | $5,650 | $522,200 | $416,700 | $105,500 |
| 2017 | $5,478 | $492,600 | $393,100 | $99,500 |
| 2016 | $5,239 | $460,400 | $367,400 | $93,000 |
| 2015 | $4,996 | $430,300 | $343,400 | $86,900 |
Source: Public Records
Map
Nearby Homes
- 44 Westland Ave
- 287 Cherry St Unit 2
- 106 River St Unit 18
- 106 River St Unit 2
- 106 River St Unit 14
- 2 Elm St Unit 6
- 2 Elm St Unit 8
- 56 Dearborn St
- 41 Kilburn Rd
- 371 Cherry St
- 212 River St Unit 2
- 42 Evergreen Cir
- 90 Auburndale Ave
- 53-55 N Gate Park
- 33 Lill Ave
- 66 Webster St
- 265-267 River St Unit 267
- 265-267 River St Unit 265
- 429 Cherry St Unit 11
- 334 River St