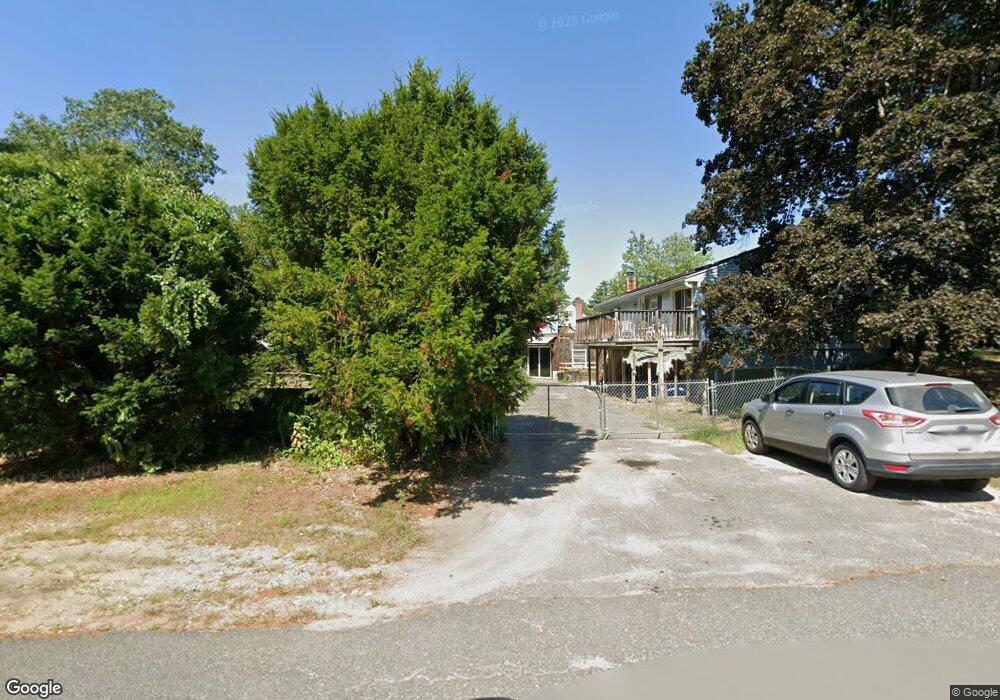
37 Memory Ln Orange, MA 01364
Estimated Value: $329,000 - $490,000
5
Beds
3
Baths
2,403
Sq Ft
$168/Sq Ft
Est. Value
About This Home
This home is located at 37 Memory Ln, Orange, MA 01364 and is currently estimated at $402,645, approximately $167 per square foot. 37 Memory Ln is a home located in Franklin County with nearby schools including Fisher Hill and Ralph C Mahar Regional School.
Ownership History
Date
Name
Owned For
Owner Type
Purchase Details
Closed on
Jan 12, 2004
Sold by
Macomber Barbara K
Bought by
Macomber Larry B and Macomber Lisa A
Current Estimated Value
Home Financials for this Owner
Home Financials are based on the most recent Mortgage that was taken out on this home.
Original Mortgage
$81,500
Interest Rate
5.65%
Purchase Details
Closed on
Oct 29, 1993
Sold by
Rathburn Richard K and Rathburn Judith H
Bought by
Macomber Terry B
Create a Home Valuation Report for This Property
The Home Valuation Report is an in-depth analysis detailing your home's value as well as a comparison with similar homes in the area
Home Values in the Area
Average Home Value in this Area
Purchase History
| Date | Buyer | Sale Price | Title Company |
|---|---|---|---|
| Macomber Larry B | -- | -- | |
| Macomber Terry B | $2,090 | -- |
Source: Public Records
Mortgage History
| Date | Status | Borrower | Loan Amount |
|---|---|---|---|
| Open | Macomber Terry B | $119,000 | |
| Closed | Macomber Terry B | $95,000 | |
| Closed | Macomber Terry B | $81,500 |
Source: Public Records
Tax History
| Year | Tax Paid | Tax Assessment Tax Assessment Total Assessment is a certain percentage of the fair market value that is determined by local assessors to be the total taxable value of land and additions on the property. | Land | Improvement |
|---|---|---|---|---|
| 2025 | $51 | $311,400 | $32,000 | $279,400 |
| 2024 | $5,644 | $323,600 | $32,000 | $291,600 |
| 2023 | $5,731 | $319,100 | $32,000 | $287,100 |
| 2022 | $5,298 | $277,100 | $32,000 | $245,100 |
| 2021 | $4,686 | $233,700 | $53,900 | $179,800 |
| 2020 | $4,607 | $226,600 | $53,600 | $173,000 |
| 2019 | $4,252 | $188,800 | $48,000 | $140,800 |
| 2018 | $4,070 | $185,500 | $47,300 | $138,200 |
| 2017 | $3,938 | $185,500 | $47,300 | $138,200 |
| 2016 | $3,926 | $180,900 | $47,300 | $133,600 |
| 2015 | $3,714 | $178,800 | $47,300 | $131,500 |
| 2014 | $3,624 | $183,600 | $47,300 | $136,300 |
Source: Public Records
Map
Nearby Homes
Your Personal Tour Guide
Ask me questions while you tour the home.