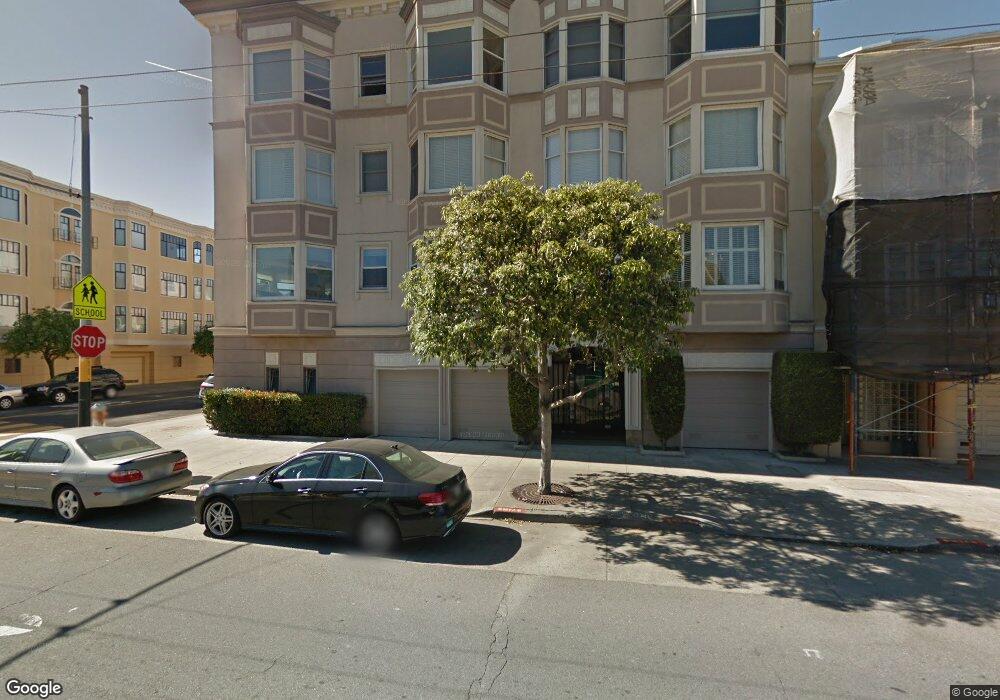
3701 Divisadero St Unit 302 San Francisco, CA 94123
Marina District NeighborhoodEstimated Value: $1,438,956 - $2,028,000
--
Bed
2
Baths
1,208
Sq Ft
$1,336/Sq Ft
Est. Value
About This Home
This home is located at 3701 Divisadero St Unit 302, San Francisco, CA 94123 and is currently estimated at $1,613,739, approximately $1,335 per square foot. 3701 Divisadero St Unit 302 is a home located in San Francisco County with nearby schools including Cobb (William L.) Elementary School, Roosevelt Middle School, and Hillwood Academic Day School.
Ownership History
Date
Name
Owned For
Owner Type
Purchase Details
Closed on
Apr 16, 2007
Sold by
Shah Ramesh and Shah Sanjay R
Bought by
Shah Sanjay
Current Estimated Value
Home Financials for this Owner
Home Financials are based on the most recent Mortgage that was taken out on this home.
Original Mortgage
$626,000
Outstanding Balance
$362,011
Interest Rate
5.37%
Mortgage Type
New Conventional
Estimated Equity
$1,251,728
Purchase Details
Closed on
Oct 21, 2003
Sold by
Crane Howard C
Bought by
Shah Ramesh and Shah Sanjay R
Home Financials for this Owner
Home Financials are based on the most recent Mortgage that was taken out on this home.
Original Mortgage
$626,400
Interest Rate
3.12%
Mortgage Type
Purchase Money Mortgage
Purchase Details
Closed on
May 4, 2001
Sold by
Cimino Rosemarie 1996 Revoc Tr and Cimino Rosemarie
Bought by
Crane Howard C and Howard C Crane Revocable Trust
Purchase Details
Closed on
Aug 30, 1996
Sold by
Rosemarie Cimino
Bought by
Cimino Rosemarie
Create a Home Valuation Report for This Property
The Home Valuation Report is an in-depth analysis detailing your home's value as well as a comparison with similar homes in the area
Home Values in the Area
Average Home Value in this Area
Purchase History
| Date | Buyer | Sale Price | Title Company |
|---|---|---|---|
| Shah Sanjay | -- | Chicago Title Co | |
| Shah Ramesh | $783,000 | Commonwealth Title Company | |
| Crane Howard C | $700,000 | First American Title | |
| Cimino Rosemarie | -- | -- |
Source: Public Records
Mortgage History
| Date | Status | Borrower | Loan Amount |
|---|---|---|---|
| Open | Shah Sanjay | $626,000 | |
| Closed | Shah Ramesh | $626,400 |
Source: Public Records
Tax History Compared to Growth
Tax History
| Year | Tax Paid | Tax Assessment Tax Assessment Total Assessment is a certain percentage of the fair market value that is determined by local assessors to be the total taxable value of land and additions on the property. | Land | Improvement |
|---|---|---|---|---|
| 2025 | $13,628 | $1,113,232 | $556,616 | $556,616 |
| 2024 | $13,628 | $1,091,404 | $545,702 | $545,702 |
| 2023 | $13,405 | $1,070,004 | $535,002 | $535,002 |
| 2022 | $13,141 | $1,049,024 | $524,512 | $524,512 |
| 2021 | $12,908 | $1,028,456 | $514,228 | $514,228 |
| 2020 | $12,972 | $1,017,912 | $508,956 | $508,956 |
| 2019 | $12,530 | $997,956 | $498,978 | $498,978 |
| 2018 | $12,110 | $978,392 | $489,196 | $489,196 |
| 2017 | $11,669 | $959,208 | $479,604 | $479,604 |
| 2016 | $11,474 | $940,400 | $470,200 | $470,200 |
| 2015 | $11,332 | $926,276 | $463,138 | $463,138 |
| 2014 | $11,035 | $908,132 | $454,066 | $454,066 |
Source: Public Records
Map
Nearby Homes
- 3736 Broderick St
- 2161 N Point St
- 1826 Beach St
- 3307 Broderick St
- 2243 Francisco St
- 3460 Pierce St
- 2534 Chestnut St
- 25 Retiro Way
- 3675 Fillmore St Unit 302
- 1 Richardson Ave
- 3208 Pierce St Unit 406
- 2550 Greenwich St
- 3131 Pierce St Unit 406
- 2764 Greenwich St
- 2724 2728 Filbert St
- 2661-2663 Greenwich St
- 2626 Filbert St
- 2600 Filbert St
- 2762 Filbert St
- 2740 Union St
- 3701 Divisadero St Unit 305
- 3701 Divisadero St Unit 304
- 3701 Divisadero St Unit 303
- 3701 Divisadero St Unit 205
- 3701 Divisadero St Unit 204
- 3701 Divisadero St Unit 203
- 3701 Divisadero St Unit 202
- 3701 Divisadero St Unit 201
- 3701 Divisadero St Unit 105
- 3701 Divisadero St Unit 104
- 3701 Divisadero St Unit 103
- 3701 Divisadero St Unit 102
- 3701 Divisadero St Unit 101
- 2130 Beach St Unit 104
- 2130 Beach St Unit 201
- 2130 Beach St Unit 301
- 2130 Beach St Unit 202
- 2130 Beach St Unit 304
- 2130 Beach St Unit 302
- 3707 Divisadero St Unit 301