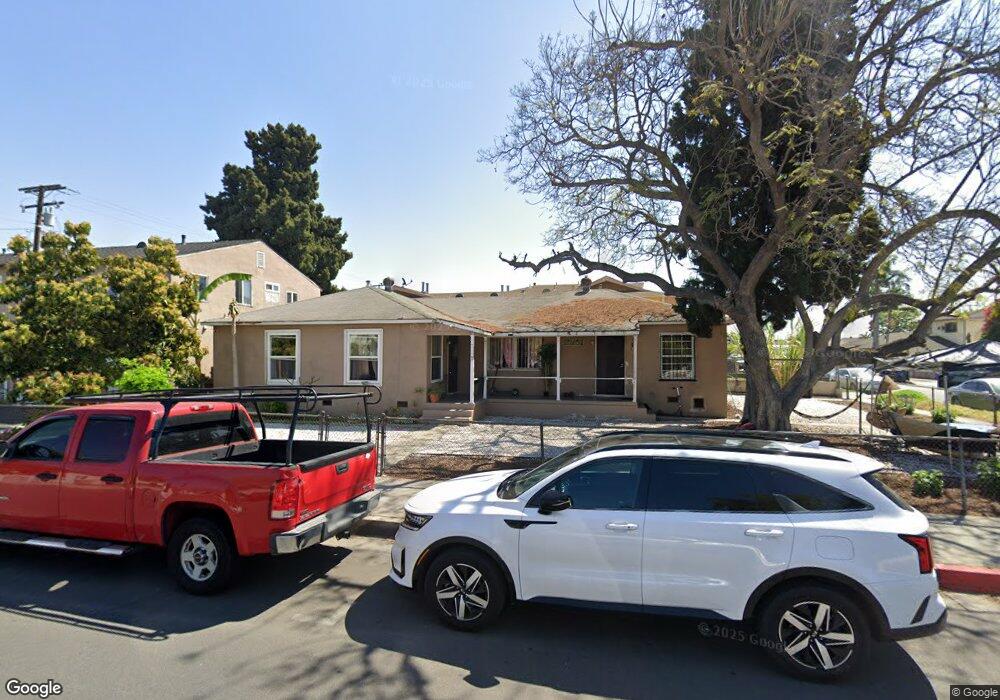
3701 E 53rd St Maywood, CA 90270
Estimated Value: $831,000 - $995,000
6
Beds
4
Baths
3,247
Sq Ft
$287/Sq Ft
Est. Value
About This Home
This home is located at 3701 E 53rd St, Maywood, CA 90270 and is currently estimated at $933,159, approximately $287 per square foot. 3701 E 53rd St is a home located in Los Angeles County with nearby schools including Loma Vista Elementary School, Chester W. Nimitz Middle School, and Maywood Academy High School.
Ownership History
Date
Name
Owned For
Owner Type
Purchase Details
Closed on
Nov 9, 2004
Sold by
Martinez David and Romero Luis A
Bought by
Martinez David and Romero Luis A
Current Estimated Value
Purchase Details
Closed on
Aug 24, 2004
Sold by
Martinez David
Bought by
Martinez David and Romero Luis A
Purchase Details
Closed on
Mar 4, 2004
Sold by
Romero Juan Carlos
Bought by
Martinez David
Home Financials for this Owner
Home Financials are based on the most recent Mortgage that was taken out on this home.
Original Mortgage
$385,700
Interest Rate
5.86%
Mortgage Type
FHA
Purchase Details
Closed on
Dec 9, 2002
Sold by
Ocampo Ramonk and The Ocampo Family Trust
Bought by
Romero Juan Carlos and Martinez David
Home Financials for this Owner
Home Financials are based on the most recent Mortgage that was taken out on this home.
Original Mortgage
$327,855
Interest Rate
5.72%
Mortgage Type
FHA
Purchase Details
Closed on
Jan 9, 1997
Sold by
Ocampo Javier and Ocampo Ramona
Bought by
Ocampo Javier and Ocampo Ramona
Create a Home Valuation Report for This Property
The Home Valuation Report is an in-depth analysis detailing your home's value as well as a comparison with similar homes in the area
Home Values in the Area
Average Home Value in this Area
Purchase History
| Date | Buyer | Sale Price | Title Company |
|---|---|---|---|
| Martinez David | -- | Landsafe Title | |
| Martinez David | -- | -- | |
| Martinez David | -- | Chicago Title Co | |
| Romero Juan Carlos | $333,000 | Fidelity National Title Co | |
| Ocampo Javier | -- | -- |
Source: Public Records
Mortgage History
| Date | Status | Borrower | Loan Amount |
|---|---|---|---|
| Previous Owner | Martinez David | $385,700 | |
| Previous Owner | Romero Juan Carlos | $327,855 |
Source: Public Records
Tax History
| Year | Tax Paid | Tax Assessment Tax Assessment Total Assessment is a certain percentage of the fair market value that is determined by local assessors to be the total taxable value of land and additions on the property. | Land | Improvement |
|---|---|---|---|---|
| 2025 | $10,433 | $713,664 | $323,378 | $390,286 |
| 2024 | $10,433 | $699,672 | $317,038 | $382,634 |
| 2023 | $10,257 | $685,954 | $310,822 | $375,132 |
| 2022 | $9,664 | $672,505 | $304,728 | $367,777 |
| 2021 | $9,538 | $659,319 | $298,753 | $360,566 |
| 2019 | $9,243 | $640,725 | $289,893 | $350,832 |
| 2018 | $9,053 | $628,181 | $284,209 | $343,972 |
| 2016 | $8,585 | $602,868 | $273,174 | $329,694 |
| 2015 | $8,091 | $593,813 | $269,071 | $324,742 |
| 2014 | $6,100 | $420,000 | $190,300 | $229,700 |
Source: Public Records
Map
Nearby Homes
- 3738 E 53rd St
- 3700 E 55th St
- 5517 Loma Vista Ave
- 5115 Loma Vista Ave
- 3725 E 57th St
- 3800 E 57th St
- 5716 Maywood Ave
- 5202 Gifford Ave
- 4101 E 57th St
- 3519 E 60th St
- 6011 Bear Ave
- 4212 E 58th St
- 4301 E 60th St
- 3201 3201 Long Beach
- 3602 Randolph Place
- 6249 Newell St
- 4026 Gage Ave
- 6048 King Ave
- 6522 Bear Ave
- 6100 Arbutus Ave Unit 42
- 5212 Loma Vista Ave
- 3715 E 53rd St
- 3657 E 53rd St
- 5217 Loma Vista Ave
- 3719 E 53rd St
- 3700 E 52nd St
- 3704 E 52nd St
- 3710 E 52nd St
- 3649 E 53rd St
- 3712 E 52nd St
- 3723 E 53rd St
- 3700 E 53rd St
- 3706 E 53rd St
- 3710 E 53rd St
- 3714 E 52nd St
- 3714 E 53rd St
- 3645 E 53rd St
- 3727 E 53rd St
- 3716 E 53rd St
- 3643 E 53rd St
Your Personal Tour Guide
Ask me questions while you tour the home.