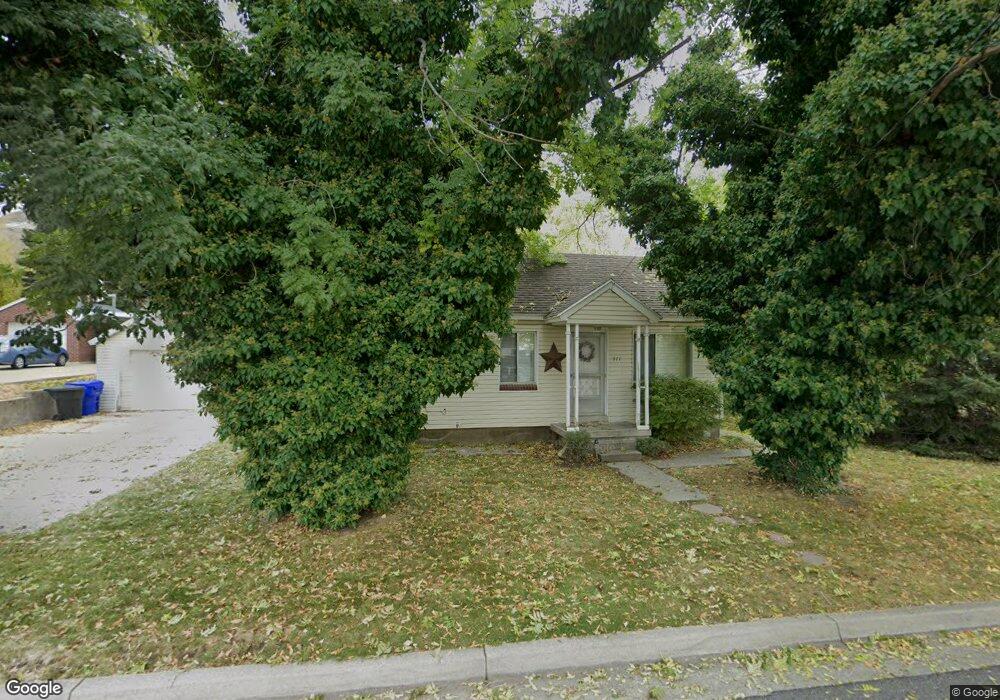
371 S 300 E Centerville, UT 84014
Estimated Value: $360,237 - $390,000
1
Bed
1
Bath
594
Sq Ft
$634/Sq Ft
Est. Value
About This Home
This home is located at 371 S 300 E, Centerville, UT 84014 and is currently estimated at $376,559, approximately $633 per square foot. 371 S 300 E is a home located in Davis County with nearby schools including J A Taylor Elementary School, Centerville Jr High, and Viewmont High School.
Ownership History
Date
Name
Owned For
Owner Type
Purchase Details
Closed on
Jan 2, 2014
Sold by
Moore Ann
Bought by
Moore Carolyn Ann
Current Estimated Value
Home Financials for this Owner
Home Financials are based on the most recent Mortgage that was taken out on this home.
Original Mortgage
$103,000
Outstanding Balance
$76,864
Interest Rate
4.17%
Mortgage Type
New Conventional
Estimated Equity
$299,695
Purchase Details
Closed on
Dec 10, 2004
Sold by
Moore Ann
Bought by
Moore Ann
Home Financials for this Owner
Home Financials are based on the most recent Mortgage that was taken out on this home.
Original Mortgage
$88,000
Interest Rate
5.7%
Mortgage Type
New Conventional
Purchase Details
Closed on
Nov 1, 2001
Sold by
Ellis Stephen C
Bought by
Moore Ann
Home Financials for this Owner
Home Financials are based on the most recent Mortgage that was taken out on this home.
Original Mortgage
$77,000
Interest Rate
6.84%
Create a Home Valuation Report for This Property
The Home Valuation Report is an in-depth analysis detailing your home's value as well as a comparison with similar homes in the area
Purchase History
| Date | Buyer | Sale Price | Title Company |
|---|---|---|---|
| Moore Carolyn Ann | -- | Hickman Land Title Co | |
| Moore Ann | -- | Lone Park Title Insurance | |
| Moore Ann | -- | Backman Stewart Title Servic |
Source: Public Records
Mortgage History
| Date | Status | Borrower | Loan Amount |
|---|---|---|---|
| Open | Moore Carolyn Ann | $103,000 | |
| Closed | Moore Ann | $88,000 | |
| Closed | Moore Ann | $77,000 |
Source: Public Records
Tax History
| Year | Tax Paid | Tax Assessment Tax Assessment Total Assessment is a certain percentage of the fair market value that is determined by local assessors to be the total taxable value of land and additions on the property. | Land | Improvement |
|---|---|---|---|---|
| 2025 | $1,685 | $161,150 | $135,793 | $25,357 |
| 2024 | $1,628 | $158,400 | $116,214 | $42,186 |
| 2023 | $1,581 | $278,000 | $198,254 | $79,746 |
| 2022 | $1,659 | $160,600 | $98,534 | $62,066 |
| 2021 | $1,605 | $242,000 | $141,861 | $100,139 |
| 2020 | $1,293 | $195,000 | $141,955 | $53,045 |
| 2019 | $1,257 | $185,000 | $158,100 | $26,900 |
| 2018 | $1,182 | $172,000 | $145,227 | $26,773 |
| 2016 | $994 | $80,355 | $40,818 | $39,537 |
| 2015 | $985 | $75,130 | $40,818 | $34,312 |
| 2014 | $996 | $77,722 | $40,818 | $36,904 |
| 2013 | -- | $66,904 | $21,085 | $45,819 |
Source: Public Records
Map
Nearby Homes
- 495 E 475 S
- 328 E 1100 S
- 150 E 735 S Unit 23
- 360 E Center St
- 16 S 200 E
- 16 W 780 S
- 967 S Courtyard Ln
- 88 W 50 S Unit C-3
- 88 W 50 S Unit B5
- 462 Pitford Dr
- 610 S 800 E
- 252 N 400 E
- 96 Village Square Rd
- 610 E Pages Ln
- 330 W Paradiso Ln
- 56 W 200 N
- 951 Centerville Commons Way
- 380 E 400 N
- 2 S 285 W
- 147 N 360 W Unit 21
Your Personal Tour Guide
Ask me questions while you tour the home.