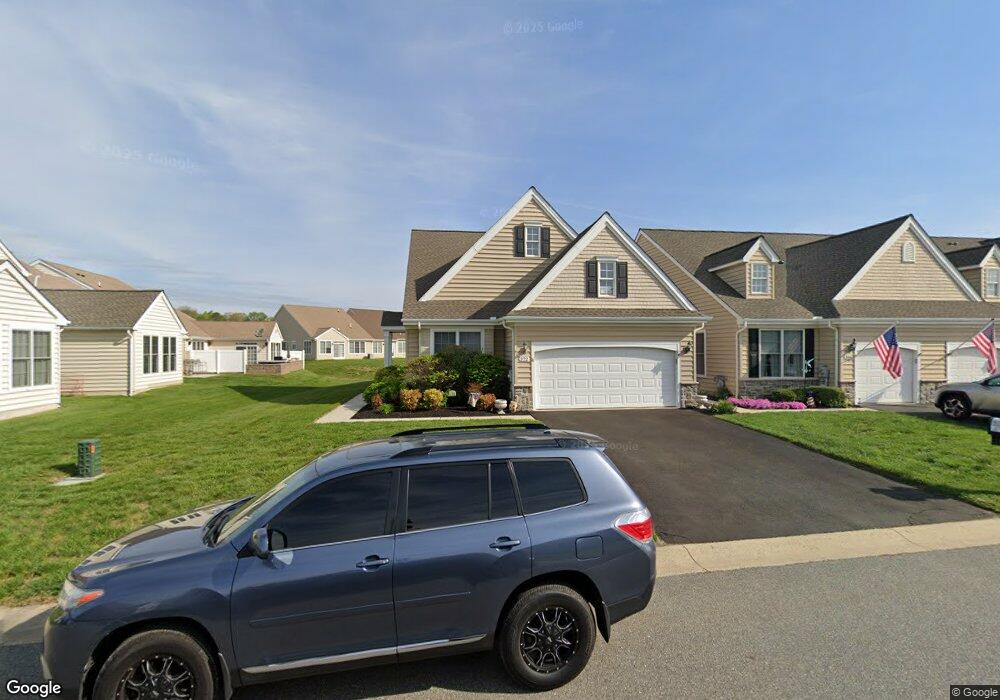
372 Spring Meadow Dr Smyrna, DE 19977
Estimated Value: $354,000 - $386,000
2
Beds
2
Baths
1,784
Sq Ft
$205/Sq Ft
Est. Value
About This Home
This home is located at 372 Spring Meadow Dr, Smyrna, DE 19977 and is currently estimated at $366,251, approximately $205 per square foot. 372 Spring Meadow Dr is a home located in Kent County with nearby schools including John Bassett Moore Intermediate School, Smyrna Elementary School, and Smyrna Middle School.
Ownership History
Date
Name
Owned For
Owner Type
Purchase Details
Closed on
Aug 31, 2012
Sold by
Sampere Anthony
Bought by
Wiley Sandra L
Current Estimated Value
Home Financials for this Owner
Home Financials are based on the most recent Mortgage that was taken out on this home.
Original Mortgage
$156,900
Outstanding Balance
$108,312
Interest Rate
3.52%
Mortgage Type
New Conventional
Estimated Equity
$257,939
Purchase Details
Closed on
Sep 30, 2008
Sold by
Hocking Janice H and Lefebvre Janice H
Bought by
Sampere Jacqueline C
Purchase Details
Closed on
Dec 28, 2006
Sold by
Wilkinson Meadow Lp
Bought by
Lefebvre Janice H
Home Financials for this Owner
Home Financials are based on the most recent Mortgage that was taken out on this home.
Original Mortgage
$285,914
Interest Rate
7.25%
Mortgage Type
Assumption
Create a Home Valuation Report for This Property
The Home Valuation Report is an in-depth analysis detailing your home's value as well as a comparison with similar homes in the area
Home Values in the Area
Average Home Value in this Area
Purchase History
| Date | Buyer | Sale Price | Title Company |
|---|---|---|---|
| Wiley Sandra L | $215,000 | None Available | |
| Sampere Jacqueline C | $240,000 | None Available | |
| Lefebvre Janice H | $317,683 | None Available |
Source: Public Records
Mortgage History
| Date | Status | Borrower | Loan Amount |
|---|---|---|---|
| Open | Wiley Sandra L | $156,900 | |
| Previous Owner | Lefebvre Janice H | $285,914 |
Source: Public Records
Tax History
| Year | Tax Paid | Tax Assessment Tax Assessment Total Assessment is a certain percentage of the fair market value that is determined by local assessors to be the total taxable value of land and additions on the property. | Land | Improvement |
|---|---|---|---|---|
| 2025 | $1,828 | $332,400 | $78,200 | $254,200 |
| 2024 | $1,790 | $332,400 | $78,200 | $254,200 |
| 2023 | $1,595 | $45,700 | $4,300 | $41,400 |
| 2022 | $1,538 | $45,700 | $4,300 | $41,400 |
| 2021 | $1,507 | $45,700 | $4,300 | $41,400 |
| 2020 | $1,348 | $45,700 | $4,300 | $41,400 |
| 2019 | $1,357 | $45,700 | $4,300 | $41,400 |
| 2018 | $1,356 | $45,700 | $4,300 | $41,400 |
| 2017 | $1,355 | $45,700 | $0 | $0 |
| 2016 | $1,308 | $45,700 | $0 | $0 |
| 2015 | $1,358 | $48,900 | $0 | $0 |
| 2014 | $1,286 | $48,900 | $0 | $0 |
Source: Public Records
Map
Nearby Homes
- 0 S Dupont Blvd Unit DEKT2042444
- 200 Spring Meadow Dr
- 64 Larkspur Ln
- 543 Sorrell Cir
- 106 Southall Ct
- 106 Southall Ct Unit CHARLESTON GRAND
- 106 Southall Ct Unit ABBOTT
- 106 Southall Ct Unit BRANDYWINE
- 106 Southall Ct Unit HANCOCK
- 106 Southall Ct Unit BERKSHIRE
- 106 Southall Ct Unit CHARLESTON
- 42 Southall Ct Unit JACKSON
- 219 Wheatsheaf Ln
- 166 Southall Ct Unit CHARLESTON GRAND
- 250 E Braeburn Dr
- 114 E Cayhill Ln
- 490 Fletcher Dr
- 421 Fletcher Dr
- 132 Winston Ct
- 7 Windy Way
- 366 Spring Meadow Dr
- 167 Sorrell Cir
- 161 Sorrell Cir
- 358 Spring Meadow Dr
- 173 Sorrell Cir
- 352 Spring Meadow Dr
- 153 Sorrell Cir
- 12 Wheatsheaf Ln
- 123 Sorrell Cir
- 340 Spring Meadow Dr
- 197 Sorrell Cir
- 107 Sorrell Cir
- 105 Sorrell Cir
- 26 Wheatsheaf Ln
- 332 Spring Meadow Dr
- 209 Sorrell Cir
- 178 Sorrell Cir
- 87 Sorrell Cir
- 326 Spring Meadow Dr
- 75 Sorrell Cir
Your Personal Tour Guide
Ask me questions while you tour the home.