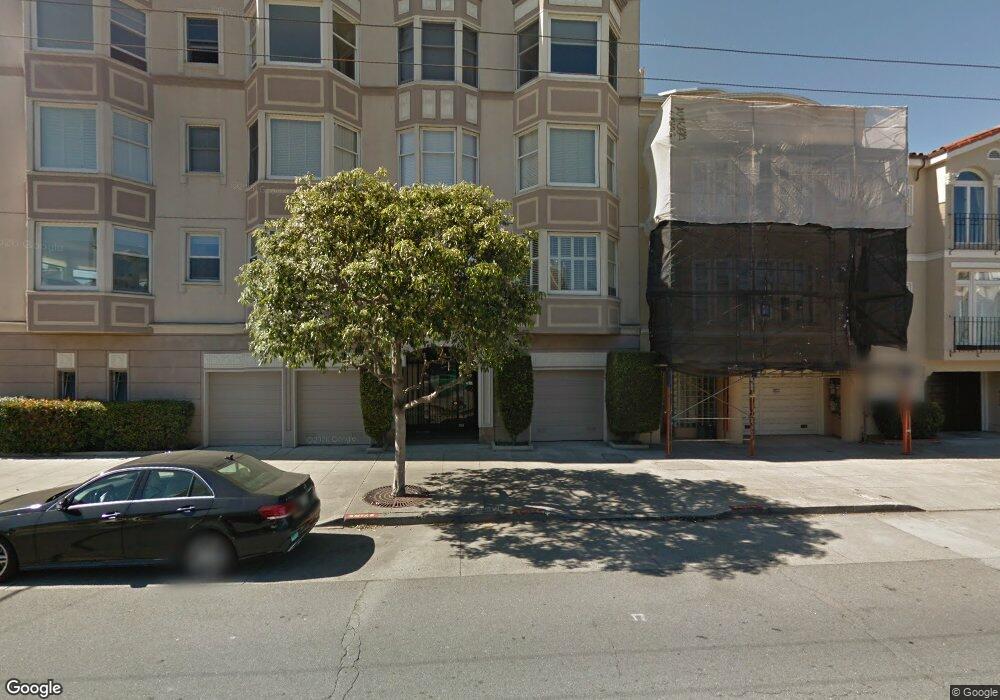
3721 Divisadero St San Francisco, CA 94123
Marina District NeighborhoodEstimated Value: $1,182,761 - $1,844,000
--
Bed
1
Bath
1,369
Sq Ft
$1,087/Sq Ft
Est. Value
About This Home
This home is located at 3721 Divisadero St, San Francisco, CA 94123 and is currently estimated at $1,488,190, approximately $1,087 per square foot. 3721 Divisadero St is a home located in San Francisco County with nearby schools including Cobb (William L.) Elementary School, Roosevelt Middle School, and Hillwood Academic Day School.
Ownership History
Date
Name
Owned For
Owner Type
Purchase Details
Closed on
May 10, 2002
Sold by
Ordona Roderick T and Ordona Shirley M H
Bought by
Ordona Roderick T and Ordona Shirley M H
Current Estimated Value
Purchase Details
Closed on
Nov 5, 1996
Sold by
Hom Patricia L
Bought by
Ordona Roderick T and Ordona Shirley M H
Home Financials for this Owner
Home Financials are based on the most recent Mortgage that was taken out on this home.
Original Mortgage
$258,500
Outstanding Balance
$22,772
Interest Rate
6.87%
Estimated Equity
$1,465,418
Purchase Details
Closed on
May 16, 1994
Sold by
Hom Ben L and Hom Patricia L
Bought by
Ordona Roderick T and Ordona Shirley M H
Home Financials for this Owner
Home Financials are based on the most recent Mortgage that was taken out on this home.
Original Mortgage
$262,500
Interest Rate
5.37%
Create a Home Valuation Report for This Property
The Home Valuation Report is an in-depth analysis detailing your home's value as well as a comparison with similar homes in the area
Home Values in the Area
Average Home Value in this Area
Purchase History
| Date | Buyer | Sale Price | Title Company |
|---|---|---|---|
| Ordona Roderick T | -- | -- | |
| Ordona Roderick T | -- | -- | |
| Ordona Roderick T | -- | Fidelity National Title Co | |
| Ordona Roderick T | -- | Fidelity National Title Co |
Source: Public Records
Mortgage History
| Date | Status | Borrower | Loan Amount |
|---|---|---|---|
| Open | Ordona Roderick T | $258,500 | |
| Closed | Ordona Roderick T | $262,500 |
Source: Public Records
Tax History Compared to Growth
Tax History
| Year | Tax Paid | Tax Assessment Tax Assessment Total Assessment is a certain percentage of the fair market value that is determined by local assessors to be the total taxable value of land and additions on the property. | Land | Improvement |
|---|---|---|---|---|
| 2025 | $4,631 | $326,751 | $124,045 | $202,706 |
| 2024 | $4,631 | $320,345 | $121,613 | $198,732 |
| 2023 | $4,507 | $314,065 | $119,229 | $194,836 |
| 2022 | $4,391 | $307,908 | $116,892 | $191,016 |
| 2021 | $4,309 | $301,871 | $114,600 | $187,271 |
| 2020 | $4,346 | $298,776 | $113,425 | $185,351 |
| 2019 | $4,203 | $292,918 | $111,201 | $181,717 |
| 2018 | $4,066 | $287,175 | $109,021 | $178,154 |
| 2017 | $3,719 | $281,545 | $106,884 | $174,661 |
| 2016 | $3,633 | $276,026 | $104,789 | $171,237 |
| 2015 | $3,586 | $271,880 | $103,215 | $168,665 |
| 2014 | $3,495 | $266,556 | $101,194 | $165,362 |
Source: Public Records
Map
Nearby Homes
- 3736 Broderick St
- 2161 N Point St
- 1826 Beach St
- 3307 Broderick St
- 2243 Francisco St
- 3460 Pierce St
- 2534 Chestnut St
- 25 Retiro Way
- 3675 Fillmore St Unit 302
- 1 Richardson Ave
- 3208 Pierce St Unit 406
- 2550 Greenwich St
- 3131 Pierce St Unit 406
- 2764 Greenwich St
- 2724 2728 Filbert St
- 2661-2663 Greenwich St
- 2626 Filbert St
- 2600 Filbert St
- 2762 Filbert St
- 2740 Union St
- 3723 Divisadero St Unit 3723
- 3723 Divisadero St Unit A
- 3723 Divisadero St
- 3717 Divisadero St
- 3729 Divisadero St
- 3719 Divisadero St
- 3731 Divisadero St
- 3733 Divisadero St
- 3737 Divisadero St
- 2130 Beach St Unit 104
- 2130 Beach St Unit 201
- 2130 Beach St Unit 301
- 2130 Beach St Unit 202
- 2130 Beach St Unit 304
- 2130 Beach St Unit 302
- 3707 Divisadero St Unit 301
- 3745 Divisadero St Unit 4
- 3701 Divisadero St Unit 305
- 3701 Divisadero St Unit 304
- 3701 Divisadero St Unit 303