Estimated Value: $377,867 - $397,000
3
Beds
2
Baths
1,382
Sq Ft
$282/Sq Ft
Est. Value
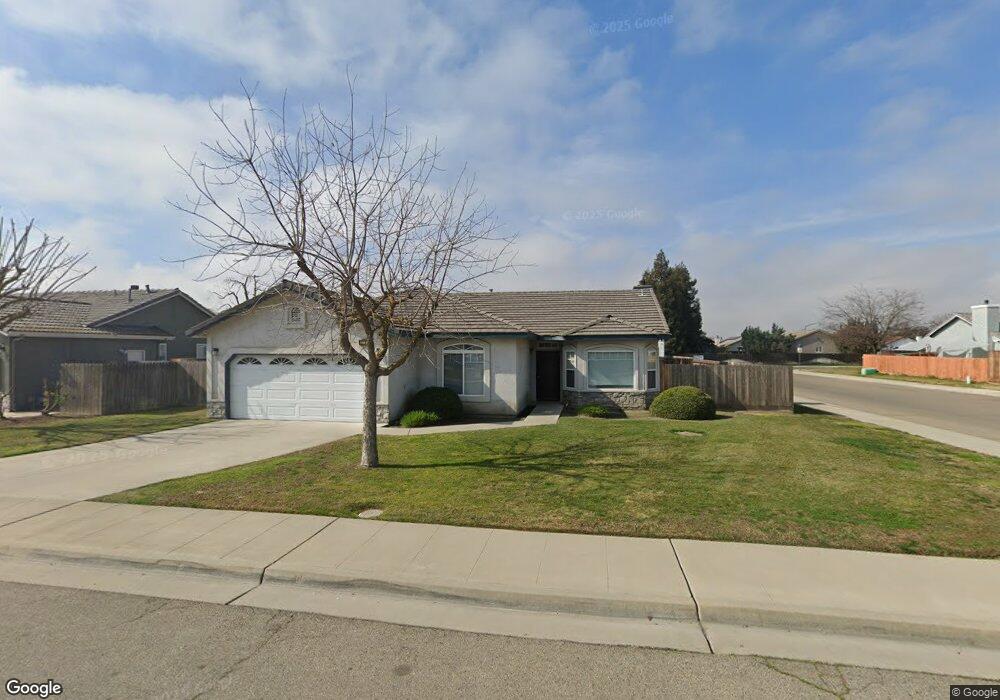
About This Home
This home is located at 3723 Bryan St, Selma, CA 93662 and is currently estimated at $389,622, approximately $281 per square foot. 3723 Bryan St is a home located in Fresno County with nearby schools including Andrew Jackson Elementary School, Abraham Lincoln Middle School, and Selma High School.
Ownership History
Date
Name
Owned For
Owner Type
Purchase Details
Closed on
Jun 24, 2011
Sold by
Secretary Of Housing & Urban Development
Bought by
Hernandez Jessica M and Rodriguez Placido
Current Estimated Value
Home Financials for this Owner
Home Financials are based on the most recent Mortgage that was taken out on this home.
Original Mortgage
$132,411
Outstanding Balance
$91,794
Interest Rate
4.75%
Mortgage Type
FHA
Estimated Equity
$297,828
Purchase Details
Closed on
Jan 25, 2011
Sold by
Wells Fargo Bank N A
Bought by
Secretary Of Housing & Urban Development
Purchase Details
Closed on
Jun 20, 2000
Sold by
Weingart Ronald C and Weingart Sherri
Bought by
Posadas Margarito G and Posadas Virginia P
Home Financials for this Owner
Home Financials are based on the most recent Mortgage that was taken out on this home.
Original Mortgage
$128,937
Interest Rate
7.98%
Mortgage Type
FHA
Create a Home Valuation Report for This Property
The Home Valuation Report is an in-depth analysis detailing your home's value as well as a comparison with similar homes in the area
Home Values in the Area
Average Home Value in this Area
Purchase History
| Date | Buyer | Sale Price | Title Company |
|---|---|---|---|
| Hernandez Jessica M | $135,000 | Chicago Title Company | |
| Secretary Of Housing & Urban Development | -- | Lsi Title Company | |
| Posadas Margarito G | $130,000 | Chicago Title Co |
Source: Public Records
Mortgage History
| Date | Status | Borrower | Loan Amount |
|---|---|---|---|
| Open | Hernandez Jessica M | $132,411 | |
| Previous Owner | Posadas Margarito G | $128,937 | |
| Closed | Posadas Margarito G | $3,900 |
Source: Public Records
Tax History
| Year | Tax Paid | Tax Assessment Tax Assessment Total Assessment is a certain percentage of the fair market value that is determined by local assessors to be the total taxable value of land and additions on the property. | Land | Improvement |
|---|---|---|---|---|
| 2025 | $3,125 | $172,947 | $51,882 | $121,065 |
| 2023 | $2,581 | $166,233 | $49,868 | $116,365 |
| 2022 | $2,872 | $162,975 | $48,891 | $114,084 |
| 2021 | $2,804 | $159,781 | $47,933 | $111,848 |
| 2020 | $2,774 | $158,144 | $47,442 | $110,702 |
| 2019 | $2,747 | $155,044 | $46,512 | $108,532 |
| 2018 | $2,685 | $152,004 | $45,600 | $106,404 |
| 2017 | $2,596 | $149,024 | $44,706 | $104,318 |
| 2016 | $2,347 | $146,103 | $43,830 | $102,273 |
| 2015 | $2,380 | $143,909 | $43,172 | $100,737 |
| 2014 | $2,319 | $141,091 | $42,327 | $98,764 |
Source: Public Records
Map
Nearby Homes
- 2705 Hicks St
- 2606 Hillcrest St
- 3654 Thompson Ave
- 2377 Tammy Ln
- 2580 Jackson St
- 3462 Shaft St
- 2222 Barbara St
- 3239 Lee St
- 8651 E Khan St
- 3280 Mccall Ave
- 8623 E Dinuba Ave
- 1701 Dinuba Ave Unit 110
- 1701 Dinuba Ave Unit 216
- 2221 Floral Ave
- 1607 Cooper St
- 2753 Thompson Ave
- 2510 Whitson St
- 1405 Huntsman Ave
- 2561 Stillman St Unit 111
- 3817 Dockery Ave
Your Personal Tour Guide
Ask me questions while you tour the home.