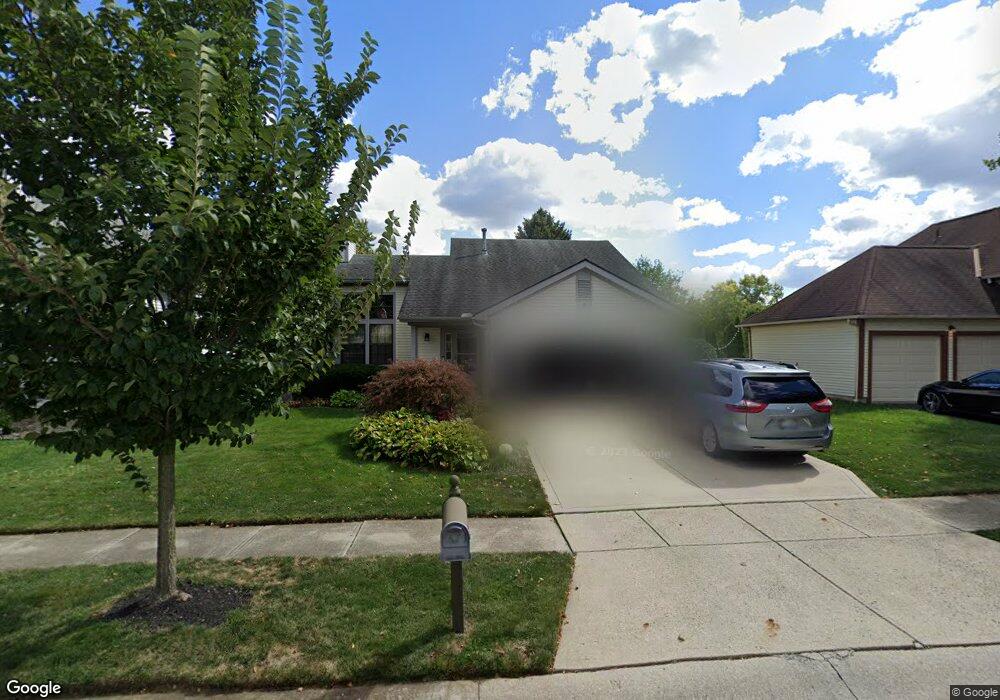
3735 Lifford Ct Columbus, OH 43221
Dexter Falls NeighborhoodEstimated Value: $367,247 - $395,000
3
Beds
2
Baths
1,316
Sq Ft
$291/Sq Ft
Est. Value
About This Home
This home is located at 3735 Lifford Ct, Columbus, OH 43221 and is currently estimated at $382,812, approximately $290 per square foot. 3735 Lifford Ct is a home located in Franklin County with nearby schools including Britton Elementary School, Hilliard Tharp Sixth Grade Elementary School, and Hilliard Weaver Middle School.
Ownership History
Date
Name
Owned For
Owner Type
Purchase Details
Closed on
Oct 1, 2012
Sold by
Fravel Loraine E and Fravel Petruska Loraine E
Bought by
Petruska Loraine E Fravel and Petruska Dennis J
Current Estimated Value
Purchase Details
Closed on
Jan 3, 1996
Sold by
Ballenger James E
Bought by
Loraine E Fravel
Home Financials for this Owner
Home Financials are based on the most recent Mortgage that was taken out on this home.
Original Mortgage
$109,800
Interest Rate
7.41%
Mortgage Type
Balloon
Purchase Details
Closed on
May 18, 1993
Purchase Details
Closed on
May 20, 1991
Create a Home Valuation Report for This Property
The Home Valuation Report is an in-depth analysis detailing your home's value as well as a comparison with similar homes in the area
Home Values in the Area
Average Home Value in this Area
Purchase History
| Date | Buyer | Sale Price | Title Company |
|---|---|---|---|
| Petruska Loraine E Fravel | -- | None Available | |
| Loraine E Fravel | $122,000 | -- | |
| -- | $54,500 | -- | |
| -- | $106,900 | -- |
Source: Public Records
Mortgage History
| Date | Status | Borrower | Loan Amount |
|---|---|---|---|
| Closed | Loraine E Fravel | $109,800 |
Source: Public Records
Tax History Compared to Growth
Tax History
| Year | Tax Paid | Tax Assessment Tax Assessment Total Assessment is a certain percentage of the fair market value that is determined by local assessors to be the total taxable value of land and additions on the property. | Land | Improvement |
|---|---|---|---|---|
| 2024 | $6,586 | $116,620 | $42,000 | $74,620 |
| 2023 | $5,706 | $116,620 | $42,000 | $74,620 |
| 2022 | $4,605 | $75,360 | $25,200 | $50,160 |
| 2021 | $4,600 | $75,360 | $25,200 | $50,160 |
| 2020 | $4,587 | $75,360 | $25,200 | $50,160 |
| 2019 | $4,379 | $61,430 | $21,000 | $40,430 |
| 2018 | $3,986 | $61,430 | $21,000 | $40,430 |
| 2017 | $4,107 | $61,430 | $21,000 | $40,430 |
| 2016 | $3,853 | $50,270 | $13,060 | $37,210 |
| 2015 | $3,611 | $50,270 | $13,060 | $37,210 |
| 2014 | $3,618 | $50,270 | $13,060 | $37,210 |
| 2013 | $1,810 | $49,630 | $12,425 | $37,205 |
Source: Public Records
Map
Nearby Homes
- 3661 Mountshannon Rd
- 3761 Carnforth Dr
- 3873 Tweedsmuir Dr
- 3552 Mountshannon Rd
- 3894 Maidens Larne Dr
- 4898 Davidson Run Dr
- 5049 Dinard Way
- 3940 Rennes Dr
- 4664 Cutwater Ln
- 5500 Saddlebrook Dr
- 3660 Rivervail Dr
- 5500 Shannon Heights Blvd
- 5506 Shannon Heights Blvd
- 3578 Braidwood Dr
- 4400 Dublin Rd
- 3741 Baybridge Ln
- 4390 Dublin Rd
- 4253 Davidson Rd
- 3119 Rivermill Dr Unit 24
- 4372 Dublin Rd
- 3727 Lifford Ct
- 3743 Lifford Ct
- 3718 Mountshannon Rd
- 3719 Lifford Ct
- 3710 Mountshannon Rd
- 3726 Mountshannon Rd
- 3700 Mountshannon Rd
- 3736 Lifford Ct
- 3711 Lifford Ct
- 3728 Lifford Ct
- 3744 Lifford Ct
- 3720 Lifford Ct
- 3692 Mountshannon Rd
- 3703 Lifford Ct
- 3712 Lifford Ct
- 5092 Dexter Falls Rd
- 5034 Flynnhaven Ct
- 3686 Mountshannon Rd
- 5042 Flynnhaven Ct
- 3701 Mountshannon Rd