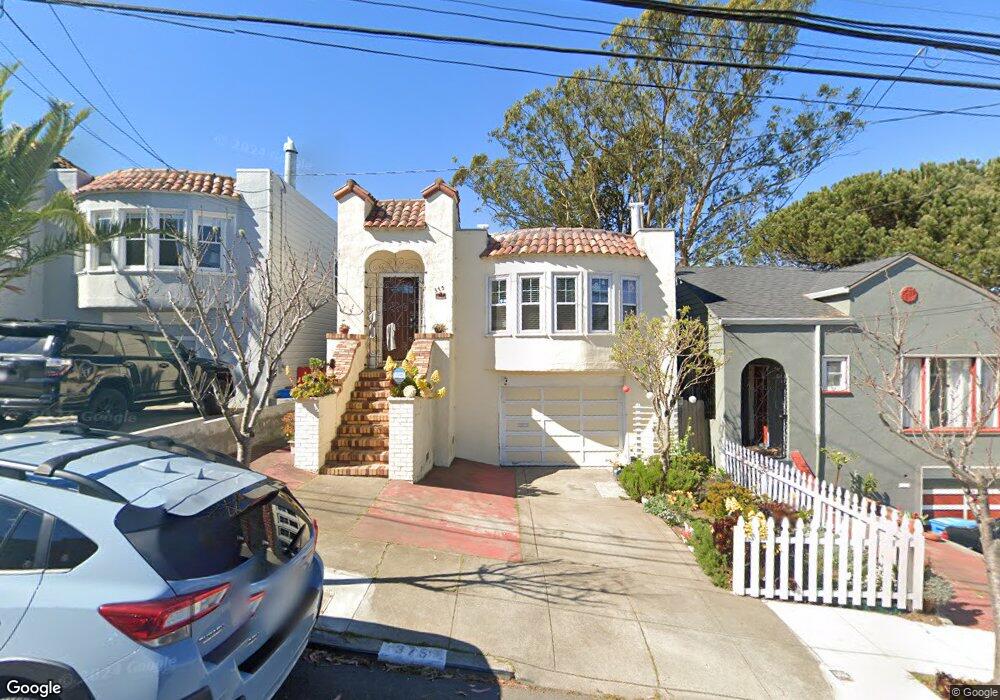
375 Ralston St San Francisco, CA 94132
Merced Heights NeighborhoodEstimated Value: $941,000 - $1,269,000
--
Bed
1
Bath
1,278
Sq Ft
$871/Sq Ft
Est. Value
About This Home
This home is located at 375 Ralston St, San Francisco, CA 94132 and is currently estimated at $1,112,894, approximately $870 per square foot. 375 Ralston St is a home located in San Francisco County with nearby schools including Ortega (Jose) Elementary School, Aptos Middle School, and Stratford School.
Ownership History
Date
Name
Owned For
Owner Type
Purchase Details
Closed on
Mar 4, 2020
Sold by
Oloresisimo Estela and Oloresisimo Estela P
Bought by
Oloresisimo Estela and The Estela Oloresisimo Revocab
Current Estimated Value
Purchase Details
Closed on
Feb 11, 1999
Sold by
Oloresisimo Danilo E and Oloresisimo Estela P
Bought by
Oloresisimo Danilo E and Oloresisimo Estela P
Home Financials for this Owner
Home Financials are based on the most recent Mortgage that was taken out on this home.
Original Mortgage
$240,000
Outstanding Balance
$56,953
Interest Rate
6.77%
Estimated Equity
$1,055,941
Purchase Details
Closed on
Jan 25, 1996
Sold by
Gordon Martha
Bought by
Oloresisimo Danilo E and Oloresisimo Estela P
Home Financials for this Owner
Home Financials are based on the most recent Mortgage that was taken out on this home.
Original Mortgage
$211,450
Interest Rate
5.87%
Create a Home Valuation Report for This Property
The Home Valuation Report is an in-depth analysis detailing your home's value as well as a comparison with similar homes in the area
Home Values in the Area
Average Home Value in this Area
Purchase History
| Date | Buyer | Sale Price | Title Company |
|---|---|---|---|
| Oloresisimo Estela | -- | None Available | |
| Oloresisimo Danilo E | -- | Old Republic Title Company | |
| Oloresisimo Danilo E | $235,000 | Commonwealth Land Title Co |
Source: Public Records
Mortgage History
| Date | Status | Borrower | Loan Amount |
|---|---|---|---|
| Open | Oloresisimo Danilo E | $240,000 | |
| Closed | Oloresisimo Danilo E | $211,450 |
Source: Public Records
Tax History Compared to Growth
Tax History
| Year | Tax Paid | Tax Assessment Tax Assessment Total Assessment is a certain percentage of the fair market value that is determined by local assessors to be the total taxable value of land and additions on the property. | Land | Improvement |
|---|---|---|---|---|
| 2025 | $5,191 | $390,370 | $232,566 | $157,804 |
| 2024 | $5,191 | $382,716 | $228,006 | $154,710 |
| 2023 | $5,102 | $375,213 | $223,536 | $151,677 |
| 2022 | $4,990 | $367,856 | $219,153 | $148,703 |
| 2021 | $4,895 | $360,644 | $214,856 | $145,788 |
| 2020 | $4,934 | $356,947 | $212,653 | $144,294 |
| 2019 | $4,768 | $349,949 | $208,484 | $141,465 |
| 2018 | $4,607 | $343,089 | $204,397 | $138,692 |
| 2017 | $4,253 | $336,363 | $200,390 | $135,973 |
| 2016 | $4,645 | $329,768 | $196,461 | $133,307 |
| 2015 | $4,759 | $324,815 | $193,510 | $131,305 |
| 2014 | $3,996 | $318,453 | $189,720 | $128,733 |
Source: Public Records
Map
Nearby Homes
- 531 Arch St
- 424 Garfield St
- 621 Shields St
- 230 Ralston St
- 131 Beverly St
- 442 Bright St
- 233 Sargent St
- 119 Vernon St
- 475 Head St
- 20 Sargent St
- 274 Montana St
- 118 Summit Way
- 73 Summit Way
- 337 Jules Ave
- 114 Saint Charles Ave
- 150 Chester Ave
- 914 Capitol Ave
- 2 Westgate Dr
- 8100 Oceanview Terrace Unit 112
- 275 Miramar Ave