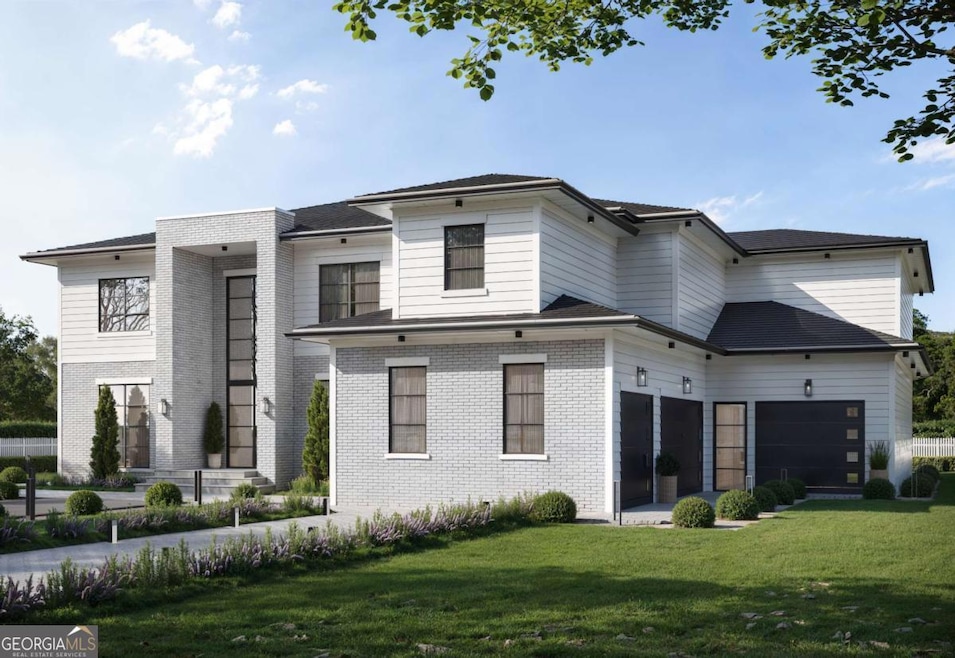
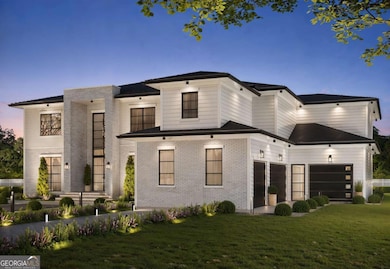
3769 High Green Dr Marietta, GA 30068
Indian Hills Country Club NeighborhoodEstimated payment $13,020/month
Highlights
- Golf Course Community
- Second Kitchen
- Dining Room Seats More Than Twelve
- East Side Elementary School Rated A
- Home Theater
- Clubhouse
About This Home
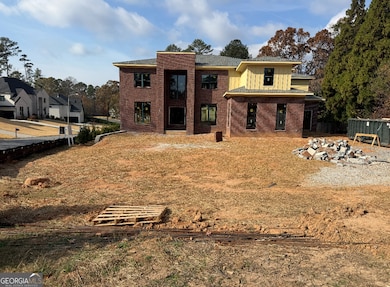
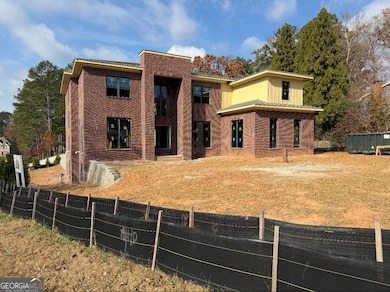
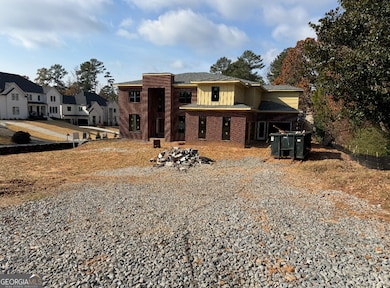
WALTON HS DISTRICT - Welcome to a timeless new construction home in the heart of Indian Hills / East Cobb where elegance meets functionality. Set on a large landscaped lot with a 4-car garage and an unfinished basement ready for future customization, this 5-bedroom, 5.5-bath residence is flooded with natural light and thoughtfully crafted details. Step inside to a grand foyer that leads to a private study and an expansive dining room that comfortably seats 12+. The main level also features a guest suite with a full bath, a separate powder room, and a custom mudroom. The heart of the home is a designer kitchen outfitted with top-of-the-line appliances, a sunny breakfast room, and a hidden scullery, perfect for entertaining. The kitchen flows seamlessly into the inviting family room with a cozy fireplace and backyard views. Upstairs, a spacious media room with trey ceilings offers endless possibilities. The oversized owner's suite is a luxurious haven with a private sitting area, his and hers walk-in closets, and a spa-inspired bath complete with double vanities, a soaking tub and a separate glass shower. Three additional en-suite bedrooms and an upstairs laundry room complete the upper level. Enjoy peaceful mornings and cozy evenings on the covered patio with a walk out backyard and outdoor fireplace, ideal for a future pool! Located minutes from top-rated schools, shopping, dining, parks, and major highways, this exquisite East Cobb home offers sophisticated living in an unbeatable location.
Home Details
Home Type
- Single Family
Est. Annual Taxes
- $1,103
Year Built
- Built in 2025 | Under Construction
Lot Details
- 0.51 Acre Lot
- Cul-De-Sac
- Corner Lot
- Level Lot
Home Design
- Contemporary Architecture
- Composition Roof
- Wood Siding
- Three Sided Brick Exterior Elevation
Interior Spaces
- 2-Story Property
- Wet Bar
- High Ceiling
- Ceiling Fan
- Double Pane Windows
- Mud Room
- Entrance Foyer
- Family Room with Fireplace
- 2 Fireplaces
- Dining Room Seats More Than Twelve
- Formal Dining Room
- Home Theater
- Home Office
- Loft
- Unfinished Basement
- Stubbed For A Bathroom
Kitchen
- Second Kitchen
- Breakfast Area or Nook
- Breakfast Bar
- Walk-In Pantry
- Built-In Oven
- Cooktop
- Dishwasher
- Kitchen Island
- Solid Surface Countertops
- Disposal
Flooring
- Wood
- Tile
Bedrooms and Bathrooms
- Walk-In Closet
- Double Vanity
- Soaking Tub
- Separate Shower
Laundry
- Laundry Room
- Laundry on upper level
Home Security
- Carbon Monoxide Detectors
- Fire and Smoke Detector
Parking
- 4 Car Garage
- Parking Accessed On Kitchen Level
- Side or Rear Entrance to Parking
Eco-Friendly Details
- Energy-Efficient Appliances
Outdoor Features
- Patio
- Outdoor Fireplace
Schools
- East Side Elementary School
- Dickerson Middle School
- Walton High School
Utilities
- Forced Air Zoned Heating and Cooling System
- 220 Volts
- Phone Available
- Cable TV Available
Community Details
Overview
- No Home Owners Association
- Indian Hills Subdivision
Amenities
- Clubhouse
Recreation
- Golf Course Community
- Tennis Courts
- Swim Team
- Community Pool
- Park
Map
Home Values in the Area
Average Home Value in this Area
Tax History
| Year | Tax Paid | Tax Assessment Tax Assessment Total Assessment is a certain percentage of the fair market value that is determined by local assessors to be the total taxable value of land and additions on the property. | Land | Improvement |
|---|---|---|---|---|
| 2025 | $1,099 | $197,584 | $70,000 | $127,584 |
| 2024 | $1,103 | $197,584 | $70,000 | $127,584 |
| 2023 | $908 | $201,408 | $60,000 | $141,408 |
| 2022 | $1,083 | $191,012 | $60,000 | $131,012 |
| 2021 | $1,003 | $164,300 | $60,000 | $104,300 |
| 2020 | $939 | $142,680 | $60,000 | $82,680 |
| 2019 | $939 | $142,680 | $60,000 | $82,680 |
| 2018 | $941 | $143,544 | $46,400 | $97,144 |
| 2017 | $853 | $143,544 | $46,400 | $97,144 |
| 2016 | $862 | $143,896 | $50,000 | $93,896 |
| 2015 | $843 | $119,960 | $36,000 | $83,960 |
| 2014 | $861 | $119,960 | $0 | $0 |
Property History
| Date | Event | Price | List to Sale | Price per Sq Ft |
|---|---|---|---|---|
| 11/19/2025 11/19/25 | Price Changed | $2,448,000 | +2.2% | $310 / Sq Ft |
| 11/11/2025 11/11/25 | For Sale | $2,395,000 | -- | $304 / Sq Ft |
Purchase History
| Date | Type | Sale Price | Title Company |
|---|---|---|---|
| Special Warranty Deed | -- | None Listed On Document | |
| Special Warranty Deed | -- | None Listed On Document | |
| Warranty Deed | $750,000 | None Listed On Document | |
| Warranty Deed | $750,000 | None Listed On Document | |
| Deed | $193,000 | -- |
Mortgage History
| Date | Status | Loan Amount | Loan Type |
|---|---|---|---|
| Open | $900,000 | Construction | |
| Closed | $900,000 | Construction | |
| Previous Owner | $183,350 | New Conventional |
Source: Georgia MLS
MLS Number: 10641724
APN: 16-1040-0-049-0
Disclaimer: Certain information contained herein is derived from information provided by parties other than Homes.com. All information provided is deemed reliable, but is not guaranteed to be accurate and should be independently verified.
![]() The data relating to real estate for sale on this web site comes in part from the Broker Reciprocity Program of Georgia MLS. Real estate listings held by brokerage firms other than Redfin are marked with the Broker Reciprocity logo and detailed information about them includes the name of the listing brokers. Information deemed reliable but not guaranteed. Copyright 2025 Georgia MLS. All rights reserved.
The data relating to real estate for sale on this web site comes in part from the Broker Reciprocity Program of Georgia MLS. Real estate listings held by brokerage firms other than Redfin are marked with the Broker Reciprocity logo and detailed information about them includes the name of the listing brokers. Information deemed reliable but not guaranteed. Copyright 2025 Georgia MLS. All rights reserved.
- 3760 Creekstone Way
- 3506 Clubland Dr Unit 6
- 3542 Clubland Dr
- 3700 Robinson Rd NE
- 4121 Fawn Ct
- 870 Muirfield Trace
- 4040 Summit Dr Unit 9
- 3442 Fox Hollow Dr
- 590 Clubwood Ct
- 3661 Clubwood Trail
- 1164 Fairfield Dr
- 4096 Audubon Dr Unit 4096
- 500 Ridgewater Dr
- 4095 Audubon Dr
- 575 Indian Hills Pkwy
- 1195 Fielding Way
- 3792 Raccoon Run
- 500 Ridgewater Dr
- 455 Cove Dr NE Unit ID1019255P
- 1038 Seven Springs Cir
- 673 Fairfield Dr Unit ID1019257P
- 1200 Mitsy Forest Dr NE
- 3785 Lower Roswell Rd
- 4500 Woodlawn Lake Dr
- 3040 Clearbrook Dr
- 4512 Woodlawn Lake Dr
- 2984 Blackberry Ln
- 392 Greenfield Ct
- 1645 Bill Murdock Rd
- 1551 Johnson Ferry Rd
- 1386 Heritage Glen Dr
- 915 Woodlawn Dr NE
- 4198 Lake Rill Ct
- 1610 Old Mill Crossing
- 3852 Emerson St
- 398 Woodhaven Trail NE
- 119 Woodlawn Dr NE
