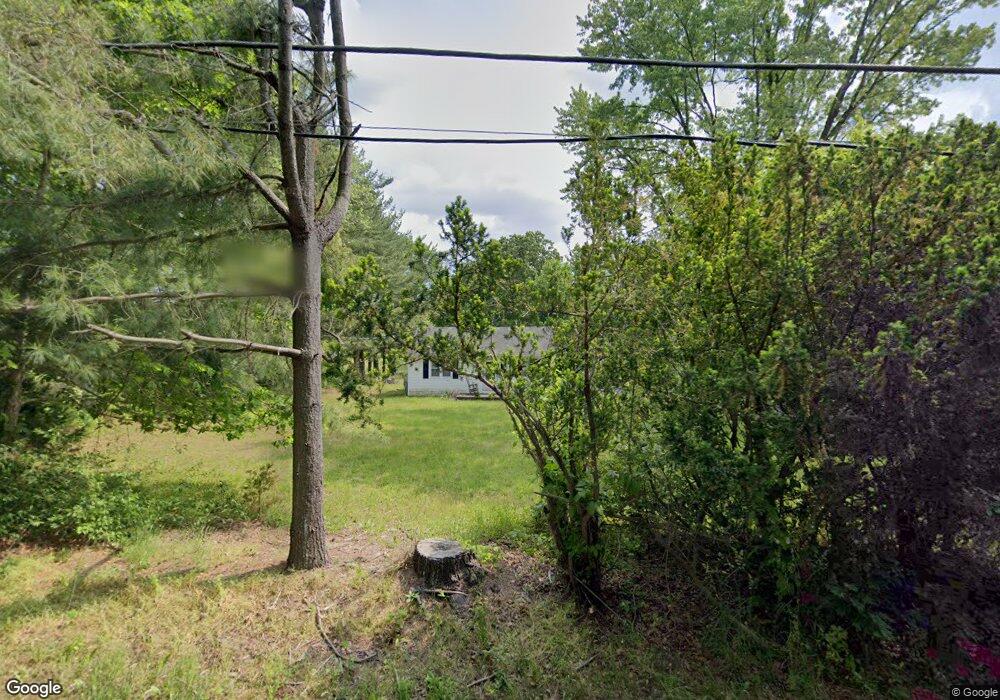
377 Ferrell Rd Mullica Hill, NJ 08062
Estimated Value: $202,746 - $518,000
--
Bed
--
Bath
768
Sq Ft
$411/Sq Ft
Est. Value
About This Home
This home is located at 377 Ferrell Rd, Mullica Hill, NJ 08062 and is currently estimated at $315,937, approximately $411 per square foot. 377 Ferrell Rd is a home located in Gloucester County with nearby schools including South Harrison Township Elementary School, Kingsway Regional Middle School, and Kingsway Reg High School.
Ownership History
Date
Name
Owned For
Owner Type
Purchase Details
Closed on
Aug 21, 2015
Sold by
Sundberg Carl B and Sundberg Margaret U
Bought by
Sundberg Carl B and Sundberg Margaret U
Current Estimated Value
Home Financials for this Owner
Home Financials are based on the most recent Mortgage that was taken out on this home.
Original Mortgage
$116,000
Outstanding Balance
$91,357
Interest Rate
4.07%
Mortgage Type
New Conventional
Estimated Equity
$224,580
Purchase Details
Closed on
Apr 9, 2010
Sold by
Boda Carrie
Bought by
Sundberg Carl B and Sundberg Margaret U
Purchase Details
Closed on
Aug 21, 2003
Sold by
Crowley James F and Boda Carrie
Bought by
Sundberg Carl B and Sundberg Margaret U
Purchase Details
Closed on
Jul 21, 2003
Sold by
Crowley James F and Boda Carrie
Bought by
Crowley James F and Boda Carrie
Purchase Details
Closed on
Apr 18, 2000
Sold by
Crowley James F
Bought by
Crowley James F and Boda Carrie
Create a Home Valuation Report for This Property
The Home Valuation Report is an in-depth analysis detailing your home's value as well as a comparison with similar homes in the area
Home Values in the Area
Average Home Value in this Area
Purchase History
| Date | Buyer | Sale Price | Title Company |
|---|---|---|---|
| Sundberg Carl B | -- | Foundation Title Llc | |
| Sundberg Carl B | -- | Foundation Title Llc | |
| Sundberg Carl B | -- | None Available | |
| Sundberg Carl B | -- | -- | |
| Crowley James F | -- | -- | |
| Crowley James F | $60,000 | Fidelity National Title Ins |
Source: Public Records
Mortgage History
| Date | Status | Borrower | Loan Amount |
|---|---|---|---|
| Open | Sundberg Carl B | $116,000 | |
| Closed | Sundberg Carl B | $116,000 |
Source: Public Records
Tax History Compared to Growth
Tax History
| Year | Tax Paid | Tax Assessment Tax Assessment Total Assessment is a certain percentage of the fair market value that is determined by local assessors to be the total taxable value of land and additions on the property. | Land | Improvement |
|---|---|---|---|---|
| 2025 | $4,582 | $149,200 | $90,200 | $59,000 |
| 2024 | $4,509 | $149,200 | $90,200 | $59,000 |
| 2023 | $4,509 | $149,200 | $90,200 | $59,000 |
| 2022 | $4,398 | $149,200 | $90,200 | $59,000 |
| 2021 | $4,366 | $149,200 | $90,200 | $59,000 |
| 2020 | $4,346 | $149,200 | $90,200 | $59,000 |
| 2019 | $4,406 | $149,200 | $90,200 | $59,000 |
| 2018 | $4,339 | $149,200 | $90,200 | $59,000 |
| 2017 | $4,275 | $149,200 | $90,200 | $59,000 |
| 2016 | $4,231 | $149,200 | $90,200 | $59,000 |
| 2015 | $4,204 | $149,200 | $90,200 | $59,000 |
| 2014 | $4,024 | $149,200 | $90,200 | $59,000 |
Source: Public Records
Map
Nearby Homes
- 893 Clover Dr
- 994 Lincoln Rd
- 2A Laurel Dr
- 735 Woodside Dr
- 244 Iris Rd
- 110 Foxford Ln
- 163 Ashwood Dr
- 1444 Commissioners Rd
- 812 Lincoln Rd
- 735 New Jersey 77
- 317 Meadowbrook Dr
- 326 Meadowbrook Dr
- 646 Lincoln Rd
- 197 Cedar Grove Rd
- 335 Elk Rd
- 107 Millstone Way
- 713 Franklinville Rd
- 105 Cedar Grove Rd
- 384 -386 Pine Tavern Rd
- 24 Fox Haven Ln
- 375 Ferrell Rd
- 371 Ferrell Rd
- 376 Ferrell Rd
- 384 Ferrell Rd
- 367 Ferrell Rd
- 385 Ferrell Rd
- 380 Ferrell Rd
- 387 Ferrell Rd
- 388 Ferrell Rd
- 372 Ferrell Rd
- 391 Ferrell Rd
- 364 Ferrell Rd
- 393 Ferrell Rd
- 382 Ferrell Rd
- 374 Ferrell Rd
- 374 Ferrell Rd Unit D
- 374 Ferrell Rd
- 374 Ferrell Rd Unit A
- 397 Ferrell Rd
- 400 Ferrell Rd