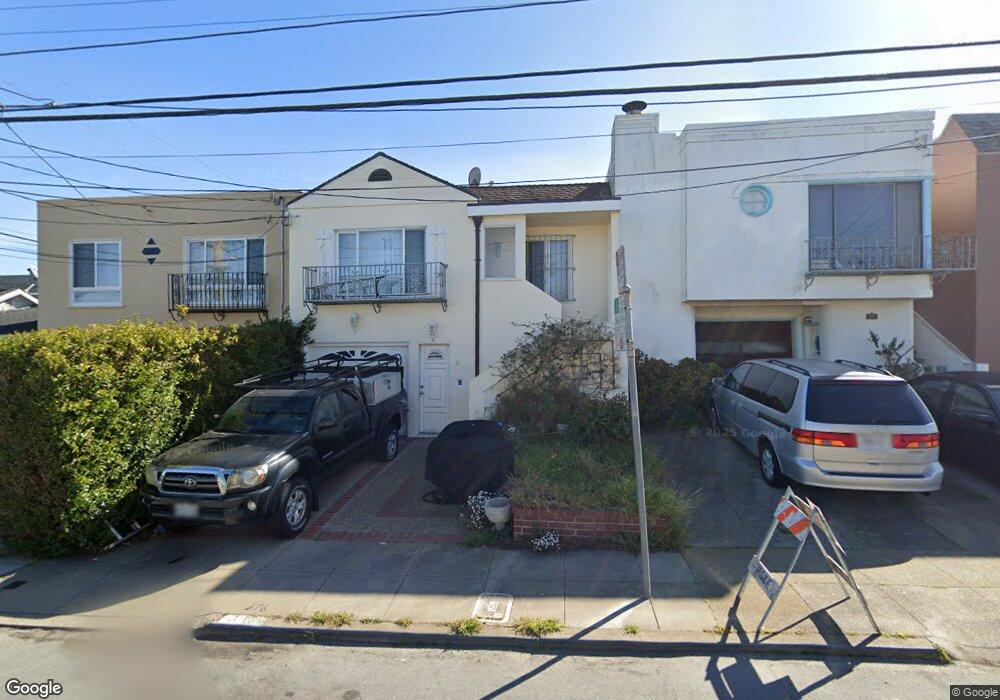
378 Monticello St San Francisco, CA 94132
Merced Heights NeighborhoodEstimated Value: $816,000 - $1,339,000
2
Beds
1
Bath
825
Sq Ft
$1,243/Sq Ft
Est. Value
About This Home
This home is located at 378 Monticello St, San Francisco, CA 94132 and is currently estimated at $1,025,670, approximately $1,243 per square foot. 378 Monticello St is a home located in San Francisco County with nearby schools including Commodore Sloat Elementary School, Aptos Middle School, and St. Stephen School.
Ownership History
Date
Name
Owned For
Owner Type
Purchase Details
Closed on
Dec 10, 2002
Sold by
Kim Thomas D and Kim Yong Hui
Bought by
Kim Thomas D and Kim Yong Hui
Current Estimated Value
Home Financials for this Owner
Home Financials are based on the most recent Mortgage that was taken out on this home.
Original Mortgage
$300,700
Interest Rate
5.43%
Create a Home Valuation Report for This Property
The Home Valuation Report is an in-depth analysis detailing your home's value as well as a comparison with similar homes in the area
Home Values in the Area
Average Home Value in this Area
Purchase History
| Date | Buyer | Sale Price | Title Company |
|---|---|---|---|
| Kim Thomas D | -- | Old Republic Title Company |
Source: Public Records
Mortgage History
| Date | Status | Borrower | Loan Amount |
|---|---|---|---|
| Closed | Kim Thomas D | $300,700 |
Source: Public Records
Tax History Compared to Growth
Tax History
| Year | Tax Paid | Tax Assessment Tax Assessment Total Assessment is a certain percentage of the fair market value that is determined by local assessors to be the total taxable value of land and additions on the property. | Land | Improvement |
|---|---|---|---|---|
| 2025 | $5,381 | $495,793 | $191,394 | $304,399 |
| 2024 | $5,381 | $399,002 | $187,642 | $211,360 |
| 2023 | $4,258 | $303,532 | $183,963 | $119,569 |
| 2022 | $4,161 | $297,581 | $180,356 | $117,225 |
| 2021 | $4,081 | $291,747 | $176,820 | $114,927 |
| 2020 | $4,396 | $288,756 | $175,007 | $113,749 |
| 2019 | $3,979 | $283,095 | $171,576 | $111,519 |
| 2018 | $3,845 | $277,545 | $168,212 | $109,333 |
| 2017 | $3,500 | $272,104 | $164,914 | $107,190 |
| 2016 | $3,415 | $266,770 | $161,681 | $105,089 |
| 2015 | $3,370 | $262,764 | $159,253 | $103,511 |
| 2014 | $3,281 | $257,618 | $156,134 | $101,484 |
Source: Public Records
Map
Nearby Homes
- 380 Monticello St
- 374 Monticello St
- 370 Monticello St
- 366 Monticello St
- 390 Monticello St
- 1325 Holloway Ave
- 362 Monticello St
- 383 Byxbee St
- 1313 Holloway Ave
- 367 Byxbee St
- 358 Monticello St
- 363 Byxbee St
- 354 Monticello St
- 395 Byxbee St
- 385 Monticello St
- 377 Monticello St
- 359 Byxbee St
- 399 Monticello St
- 365 Monticello St
- 350 Monticello St