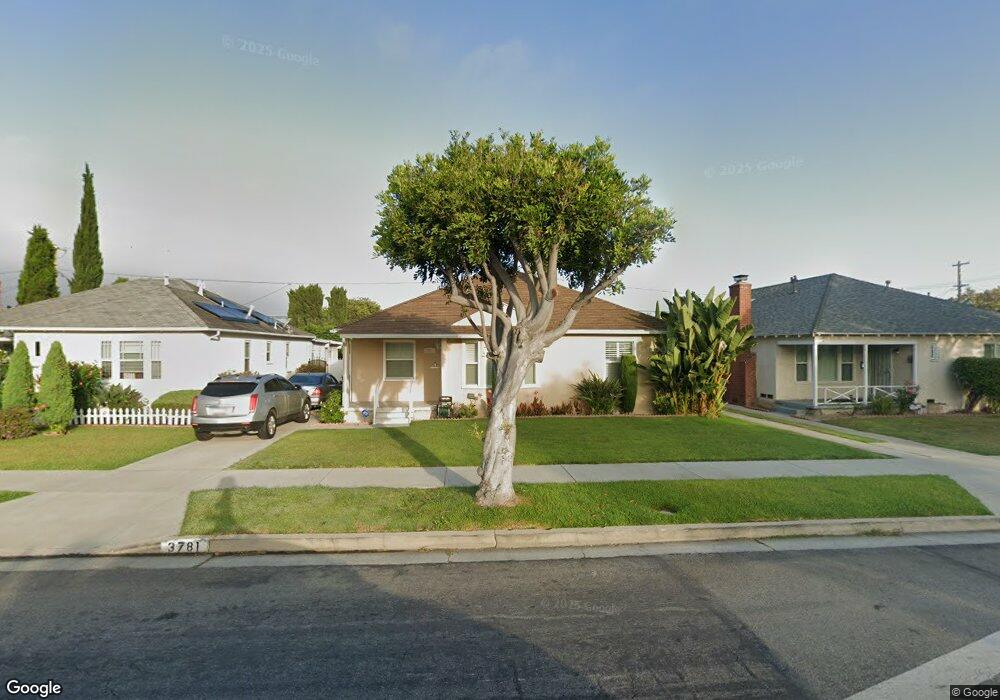
3781 Buckingham Rd Los Angeles, CA 90016
Baldwin Hills NeighborhoodEstimated Value: $1,175,181 - $1,394,000
3
Beds
2
Baths
1,728
Sq Ft
$746/Sq Ft
Est. Value
About This Home
This home is located at 3781 Buckingham Rd, Los Angeles, CA 90016 and is currently estimated at $1,288,295, approximately $745 per square foot. 3781 Buckingham Rd is a home located in Los Angeles County with nearby schools including Coliseum Street Elementary School, Audubon Middle School, and Susan Miller Dorsey Senior High School.
Ownership History
Date
Name
Owned For
Owner Type
Purchase Details
Closed on
Jan 9, 2012
Sold by
Chisum Mattie F
Bought by
Chisum Mattie F and The Chisum Family Trust
Current Estimated Value
Purchase Details
Closed on
May 15, 2006
Sold by
Chisum Mattie F
Bought by
Chisum Mattie F
Home Financials for this Owner
Home Financials are based on the most recent Mortgage that was taken out on this home.
Original Mortgage
$75,000
Outstanding Balance
$43,586
Interest Rate
6.46%
Mortgage Type
Fannie Mae Freddie Mac
Estimated Equity
$1,244,709
Purchase Details
Closed on
Jan 25, 2006
Sold by
Chisum Mattie F and The Chisum Family Trust
Bought by
Chisum Mattie F
Purchase Details
Closed on
Mar 23, 2004
Sold by
Chisum Toney and Chisum Mattie F
Bought by
Chisum Toney and Chisum Mattie F
Purchase Details
Closed on
May 12, 1997
Sold by
Smith Estell
Bought by
Chisum Toney and Chisum Mattie F
Purchase Details
Closed on
Sep 2, 1993
Sold by
Song James
Bought by
Song Chuo Yin and Song Ku Yu Chiau
Create a Home Valuation Report for This Property
The Home Valuation Report is an in-depth analysis detailing your home's value as well as a comparison with similar homes in the area
Home Values in the Area
Average Home Value in this Area
Purchase History
| Date | Buyer | Sale Price | Title Company |
|---|---|---|---|
| Chisum Mattie F | -- | None Available | |
| Chisum Mattie F | -- | Financial Title Company | |
| Chisum Mattie F | -- | None Available | |
| Chisum Toney | -- | -- | |
| Chisum Toney | -- | Old Republic Title | |
| Song Chuo Yin | -- | -- |
Source: Public Records
Mortgage History
| Date | Status | Borrower | Loan Amount |
|---|---|---|---|
| Open | Chisum Mattie F | $75,000 |
Source: Public Records
Tax History Compared to Growth
Tax History
| Year | Tax Paid | Tax Assessment Tax Assessment Total Assessment is a certain percentage of the fair market value that is determined by local assessors to be the total taxable value of land and additions on the property. | Land | Improvement |
|---|---|---|---|---|
| 2025 | $4,014 | $318,978 | $127,584 | $191,394 |
| 2024 | $4,014 | $312,725 | $125,083 | $187,642 |
| 2023 | $3,943 | $306,594 | $122,631 | $183,963 |
| 2022 | $3,771 | $300,583 | $120,227 | $180,356 |
| 2021 | $3,714 | $294,690 | $117,870 | $176,820 |
| 2019 | $3,606 | $285,951 | $114,375 | $171,576 |
| 2018 | $3,504 | $280,345 | $112,133 | $168,212 |
| 2016 | $3,337 | $269,461 | $107,780 | $161,681 |
| 2015 | $3,290 | $265,415 | $106,162 | $159,253 |
| 2014 | $3,309 | $260,217 | $104,083 | $156,134 |
Source: Public Records
Map
Nearby Homes
- 3834 West Blvd
- 3829 Wellington Rd
- 3692 Buckingham Rd
- 3682 Buckingham Rd
- 3734 Wellington Rd
- 3801 Somerset Dr
- 3518 Chesapeake Ave
- 3849 Somerset Dr
- 3770 Somerset Dr
- 3914 Somerset Dr
- 3637 Virginia Rd
- 3921 S Victoria Ave
- 3532 S Muirfield Rd
- 3522 Potomac Ave
- 3524 Chesapeake Ave
- 4108 Santa Rosalia Dr Unit A
- 3440 Buckingham Rd
- 3441 Virginia Rd
- 3444 Hillcrest Dr
- 3437 Virginia Rd
- 3787 Buckingham Rd
- 3777 Buckingham Rd
- 3801 Buckingham Rd
- 3771 Buckingham Rd
- 3780 West Blvd
- 3786 West Blvd
- 3807 Buckingham Rd
- 3767 Buckingham Rd
- 3770 West Blvd
- 3790 West Blvd
- 3782 West Blvd
- 3780 Buckingham Rd
- 3786 Buckingham Rd
- 3774 Buckingham Rd
- 3766 West Blvd
- 3800 Buckingham Rd
- 3761 Buckingham Rd
- 3811 Buckingham Rd
- 3770 Buckingham Rd
- 3800 West Blvd