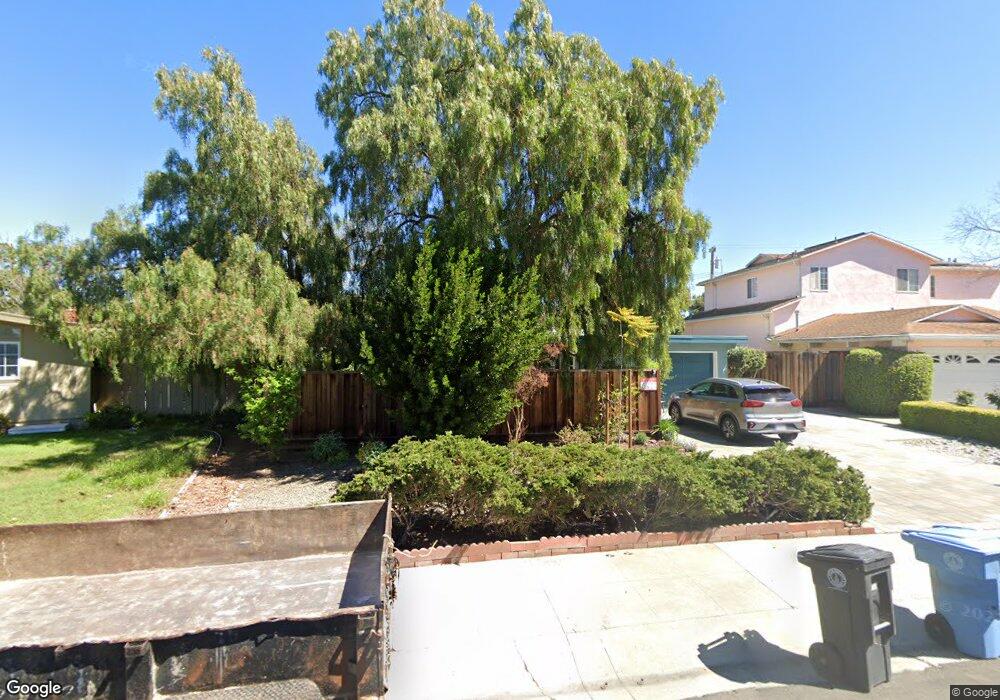
3797 Nathan Way Palo Alto, CA 94303
Adobe Meadow-Meadow Park NeighborhoodEstimated Value: $3,031,000 - $3,181,000
4
Beds
2
Baths
1,421
Sq Ft
$2,200/Sq Ft
Est. Value
About This Home
This home is located at 3797 Nathan Way, Palo Alto, CA 94303 and is currently estimated at $3,126,080, approximately $2,199 per square foot. 3797 Nathan Way is a home located in Santa Clara County with nearby schools including Fairmeadow Elementary School, Jane Lathrop Stanford Middle School, and Henry M. Gunn High School.
Ownership History
Date
Name
Owned For
Owner Type
Purchase Details
Closed on
Mar 7, 2011
Sold by
Hallsted Richard D and Mayerfeld Pamela
Bought by
Hallsted Richard and Mayerfeld Pamela
Current Estimated Value
Purchase Details
Closed on
Jun 15, 2010
Sold by
Holbrook Robin E and Biehler Ronald A
Bought by
Holbrook Robin E
Purchase Details
Closed on
Nov 26, 2007
Sold by
Holbrook Robin
Bought by
Holbrook Robin E and Biehler Ronald A
Home Financials for this Owner
Home Financials are based on the most recent Mortgage that was taken out on this home.
Original Mortgage
$100,000
Interest Rate
6.3%
Mortgage Type
Credit Line Revolving
Purchase Details
Closed on
Dec 14, 2005
Sold by
Holbrook Robin E
Bought by
Holbrook Robin
Purchase Details
Closed on
Jan 18, 2002
Sold by
Holbrook Dorothy B
Bought by
Holbrook Robin E
Create a Home Valuation Report for This Property
The Home Valuation Report is an in-depth analysis detailing your home's value as well as a comparison with similar homes in the area
Home Values in the Area
Average Home Value in this Area
Purchase History
| Date | Buyer | Sale Price | Title Company |
|---|---|---|---|
| Hallsted Richard | -- | None Available | |
| Holbrook Robin E | -- | None Available | |
| Holbrook Robin E | -- | First American Title Co | |
| Holbrook Robin | -- | -- | |
| Holbrook Robin E | -- | -- |
Source: Public Records
Mortgage History
| Date | Status | Borrower | Loan Amount |
|---|---|---|---|
| Closed | Holbrook Robin E | $100,000 | |
| Closed | Holbrook Robin E | $211,000 |
Source: Public Records
Tax History Compared to Growth
Tax History
| Year | Tax Paid | Tax Assessment Tax Assessment Total Assessment is a certain percentage of the fair market value that is determined by local assessors to be the total taxable value of land and additions on the property. | Land | Improvement |
|---|---|---|---|---|
| 2025 | $2,258 | $114,735 | $41,554 | $73,181 |
| 2024 | $2,258 | $112,487 | $40,740 | $71,747 |
| 2023 | $2,218 | $110,283 | $39,942 | $70,341 |
| 2022 | $2,182 | $108,121 | $39,159 | $68,962 |
| 2021 | $2,136 | $106,002 | $38,392 | $67,610 |
| 2020 | $2,109 | $104,916 | $37,999 | $66,917 |
| 2019 | $2,079 | $102,859 | $37,254 | $65,605 |
| 2018 | $2,041 | $100,843 | $36,524 | $64,319 |
| 2017 | $2,002 | $98,866 | $35,808 | $63,058 |
| 2016 | $1,942 | $96,928 | $35,106 | $61,822 |
| 2015 | $1,914 | $95,473 | $34,579 | $60,894 |
| 2014 | $1,777 | $93,604 | $33,902 | $59,702 |
Source: Public Records
Map
Nearby Homes
- 3839 Ross Rd
- 3482 Kenneth Dr
- 701 Christine Dr
- 4148 Byron St
- 4225 Park Blvd
- Plan 4 at 28FIFTY
- Plan 2 at 28FIFTY
- Plan 3 at 28FIFTY
- Plan 1 at 28FIFTY
- 1125 Esther Ct
- 1129 Esther Ct
- 2045 Atlas Loop
- 748 Cottage Ct
- 278 Monroe Dr Unit 8
- 853B Sierra Vista Ave
- 342 Carolina Ln
- 2760 Byron St
- 2483 Whitney Dr
- 1031 Amarillo Ave
- 915 Colonial Ln
- 3801 Nathan Way
- 3787 Nathan Way
- 3785 Nathan Way
- 3803 Nathan Way
- 3798 Nathan Way
- 3788 Nathan Way
- 3804 Nathan Way
- 3775 Nathan Way
- 3807 Nathan Way
- 3780 Nathan Way
- 3783 Nathan Way
- 3810 Nathan Way
- 3776 Nathan Way
- 3769 Nathan Way
- 3811 Nathan Way
- 3779 Nathan Way
- 3781 Nathan Way
- 3797 Louis Rd
- 3787 Louis Rd
- 3805 Louis Rd