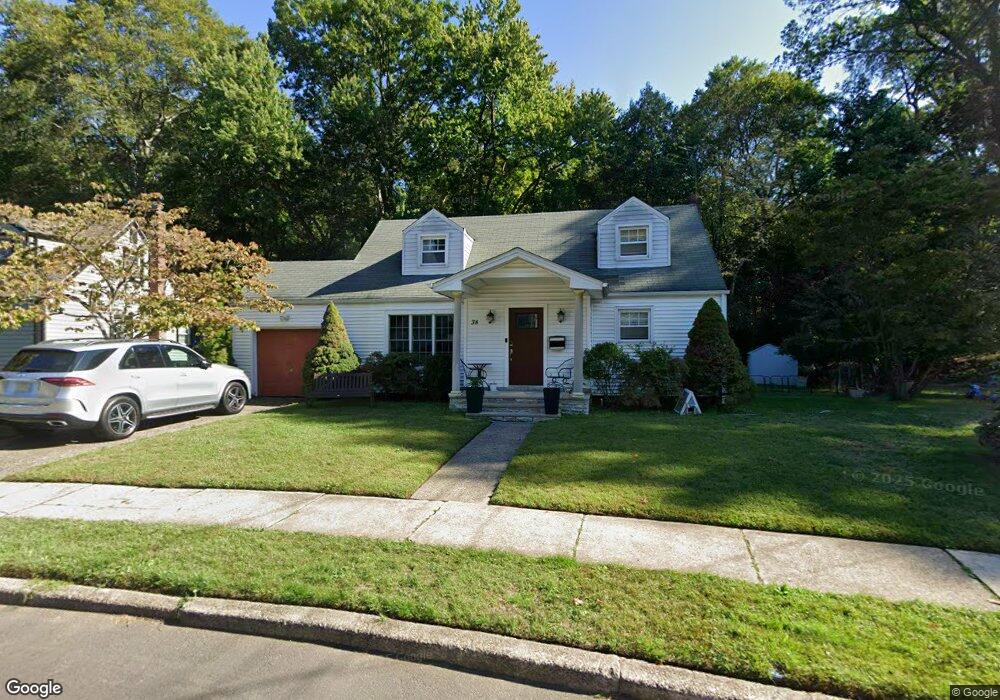
38 Brook St Hackensack, NJ 07601
Estimated Value: $649,000 - $755,000
Studio
--
Bath
1,747
Sq Ft
$393/Sq Ft
Est. Value
About This Home
This home is located at 38 Brook St, Hackensack, NJ 07601 and is currently estimated at $686,995, approximately $393 per square foot. 38 Brook St is a home located in Bergen County with nearby schools including Hackensack High School and Bergen County Christian Academy.
Ownership History
Date
Name
Owned For
Owner Type
Purchase Details
Closed on
Sep 23, 1999
Sold by
Godsil Ethel and Godsil Lillian
Bought by
Miller Raymond and Miller Beverly
Current Estimated Value
Home Financials for this Owner
Home Financials are based on the most recent Mortgage that was taken out on this home.
Original Mortgage
$197,900
Outstanding Balance
$58,580
Interest Rate
7.8%
Estimated Equity
$628,415
Create a Home Valuation Report for This Property
The Home Valuation Report is an in-depth analysis detailing your home's value as well as a comparison with similar homes in the area
Home Values in the Area
Average Home Value in this Area
Purchase History
| Date | Buyer | Sale Price | Title Company |
|---|---|---|---|
| Miller Raymond | $219,900 | Chicago Title Insurance Co |
Source: Public Records
Mortgage History
| Date | Status | Borrower | Loan Amount |
|---|---|---|---|
| Open | Miller Raymond | $197,900 |
Source: Public Records
Tax History
| Year | Tax Paid | Tax Assessment Tax Assessment Total Assessment is a certain percentage of the fair market value that is determined by local assessors to be the total taxable value of land and additions on the property. | Land | Improvement |
|---|---|---|---|---|
| 2025 | $13,388 | $438,100 | $220,200 | $217,900 |
| 2024 | $12,613 | $438,100 | $220,200 | $217,900 |
| 2023 | $11,146 | $438,100 | $220,200 | $217,900 |
| 2022 | $11,146 | $397,800 | $215,300 | $182,500 |
| 2021 | $11,414 | $339,900 | $192,700 | $147,200 |
| 2020 | $11,247 | $339,900 | $192,700 | $147,200 |
| 2019 | $11,269 | $335,700 | $189,700 | $146,000 |
| 2018 | $11,321 | $331,700 | $185,700 | $146,000 |
| 2017 | $11,198 | $327,900 | $183,200 | $144,700 |
| 2016 | $10,526 | $311,600 | $168,200 | $143,400 |
| 2015 | $10,157 | $290,200 | $179,300 | $110,900 |
| 2014 | $9,640 | $290,200 | $179,300 | $110,900 |
Source: Public Records
Map
Nearby Homes
- 137 Byrne St
- 162 E Fairmount Ave
- 258 Ross Ave
- 207 Elm Ave
- 467 Summit Ave
- 290 Clinton Place
- 446 Passaic St Unit 2A
- 113 E Fairmount Ave
- 366 E Spring Valley Ave
- 59 Washington Ave
- 262 Spring Valley Ave
- 258 Clinton Place
- 120 Louis St
- 149 Allen St
- 95 Cedar Ave
- 857 Collingwood Ave
- 483 Colonial Terrace Unit 9
- 67 Spring Valley Ave
- 300 Lookout Ave Unit C4
- 75 Pine St
Your Personal Tour Guide
Ask me questions while you tour the home.