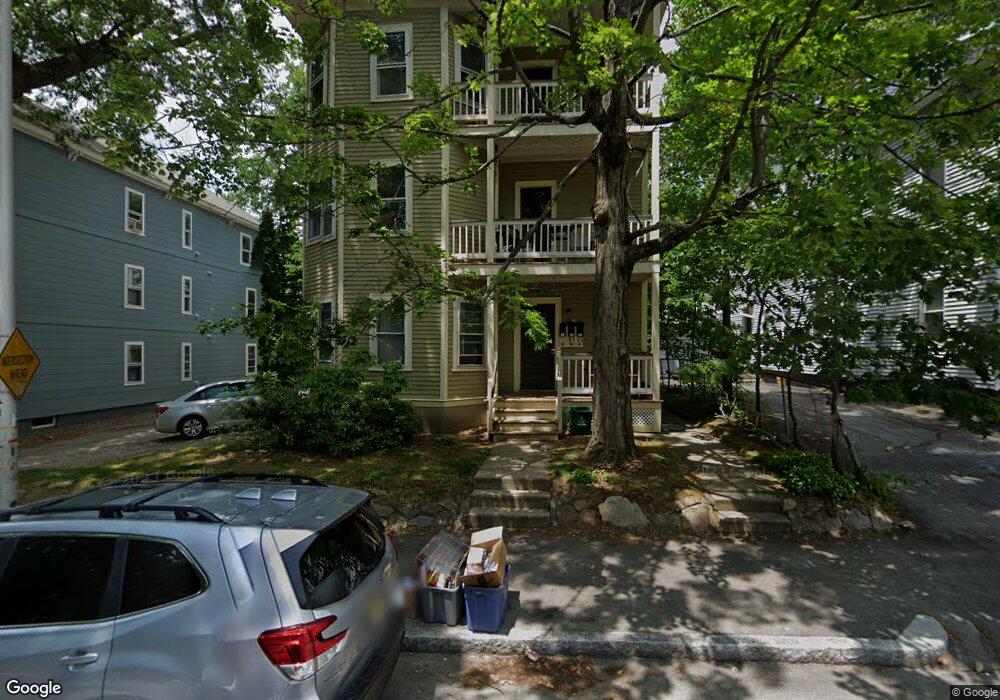
38 Florence St Worcester, MA 01610
University Park NeighborhoodEstimated Value: $610,829 - $759,000
9
Beds
3
Baths
4,143
Sq Ft
$164/Sq Ft
Est. Value
About This Home
This home is located at 38 Florence St, Worcester, MA 01610 and is currently estimated at $680,207, approximately $164 per square foot. 38 Florence St is a home located in Worcester County with nearby schools including Columbus Park Preparatory Academy, Jacob Hiatt Magnet School, and Chandler Magnet.
Ownership History
Date
Name
Owned For
Owner Type
Purchase Details
Closed on
Dec 17, 2018
Sold by
Keystone Realty Llc
Bought by
Rotti Joseph W
Current Estimated Value
Home Financials for this Owner
Home Financials are based on the most recent Mortgage that was taken out on this home.
Original Mortgage
$277,500
Outstanding Balance
$244,971
Interest Rate
4.9%
Mortgage Type
New Conventional
Estimated Equity
$435,236
Purchase Details
Closed on
Jan 13, 2014
Sold by
Poulin Leonard A
Bought by
Keystone Realty Llc
Create a Home Valuation Report for This Property
The Home Valuation Report is an in-depth analysis detailing your home's value as well as a comparison with similar homes in the area
Home Values in the Area
Average Home Value in this Area
Purchase History
| Date | Buyer | Sale Price | Title Company |
|---|---|---|---|
| Rotti Joseph W | $370,000 | -- | |
| Keystone Realty Llc | -- | -- |
Source: Public Records
Mortgage History
| Date | Status | Borrower | Loan Amount |
|---|---|---|---|
| Open | Rotti Joseph W | $277,500 |
Source: Public Records
Tax History
| Year | Tax Paid | Tax Assessment Tax Assessment Total Assessment is a certain percentage of the fair market value that is determined by local assessors to be the total taxable value of land and additions on the property. | Land | Improvement |
|---|---|---|---|---|
| 2025 | $8,978 | $680,700 | $97,800 | $582,900 |
| 2024 | $8,271 | $601,500 | $97,800 | $503,700 |
| 2023 | $7,920 | $552,300 | $85,000 | $467,300 |
| 2022 | $6,886 | $452,700 | $68,000 | $384,700 |
| 2021 | $6,383 | $392,100 | $54,400 | $337,700 |
| 2020 | $5,887 | $346,300 | $54,000 | $292,300 |
| 2019 | $5,216 | $289,800 | $47,200 | $242,600 |
| 2018 | $5,094 | $269,400 | $47,200 | $222,200 |
| 2017 | $4,772 | $248,300 | $47,200 | $201,100 |
| 2016 | $4,536 | $220,100 | $33,400 | $186,700 |
| 2015 | $4,417 | $220,100 | $33,400 | $186,700 |
| 2014 | $4,301 | $220,100 | $33,400 | $186,700 |
Source: Public Records
Map
Nearby Homes
- 36 Florence St
- 217 Dewey St
- 42 Charlotte St
- 34 Florence St
- 221 Dewey St
- 30 Florence St
- 44 Florence St
- 39 Florence St
- 39 Florence St Unit 2
- 223 Dewey St
- 35 Florence St
- 28 Florence St
- 26 Charlotte St
- 31 Florence St
- 56 Charlotte St Unit 1
- 214 Dewey St
- 29 Florence St
- 210 Dewey St
- 24 Florence St
- 218 Dewey St
Your Personal Tour Guide
Ask me questions while you tour the home.