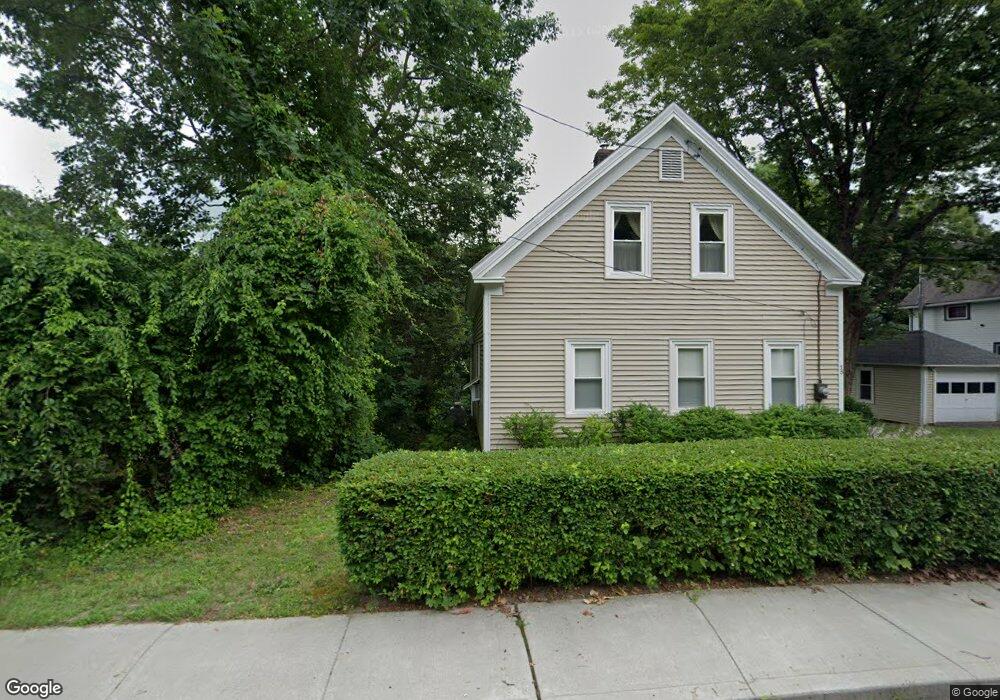
38 Williams St Shelburne Falls, MA 01370
Buckland NeighborhoodEstimated Value: $303,000 - $399,000
5
Beds
1
Bath
1,580
Sq Ft
$225/Sq Ft
Est. Value
About This Home
This home is located at 38 Williams St, Shelburne Falls, MA 01370 and is currently estimated at $355,719, approximately $225 per square foot. 38 Williams St is a home with nearby schools including Mohawk Trail Regional High School.
Ownership History
Date
Name
Owned For
Owner Type
Purchase Details
Closed on
Jul 28, 2021
Sold by
Boutwell Cecelia B Est
Bought by
Boutwell Todd A
Current Estimated Value
Home Financials for this Owner
Home Financials are based on the most recent Mortgage that was taken out on this home.
Original Mortgage
$159,600
Outstanding Balance
$145,191
Interest Rate
2.93%
Mortgage Type
Purchase Money Mortgage
Estimated Equity
$210,528
Purchase Details
Closed on
Feb 6, 1963
Bought by
Boutwell Cecelia B
Create a Home Valuation Report for This Property
The Home Valuation Report is an in-depth analysis detailing your home's value as well as a comparison with similar homes in the area
Home Values in the Area
Average Home Value in this Area
Purchase History
| Date | Buyer | Sale Price | Title Company |
|---|---|---|---|
| Boutwell Todd A | $228,000 | None Available | |
| Boutwell Cecelia B | -- | -- |
Source: Public Records
Mortgage History
| Date | Status | Borrower | Loan Amount |
|---|---|---|---|
| Open | Boutwell Todd A | $159,600 |
Source: Public Records
Tax History Compared to Growth
Tax History
| Year | Tax Paid | Tax Assessment Tax Assessment Total Assessment is a certain percentage of the fair market value that is determined by local assessors to be the total taxable value of land and additions on the property. | Land | Improvement |
|---|---|---|---|---|
| 2025 | $4,584 | $270,600 | $46,100 | $224,500 |
| 2024 | $4,481 | $255,200 | $46,100 | $209,100 |
| 2023 | $3,944 | $232,800 | $46,100 | $186,700 |
| 2022 | $3,906 | $232,800 | $46,100 | $186,700 |
| 2021 | $3,575 | $200,400 | $46,100 | $154,300 |
| 2020 | $3,458 | $186,700 | $46,100 | $140,600 |
| 2019 | $3,251 | $174,500 | $46,100 | $128,400 |
| 2018 | $3,172 | $168,300 | $46,100 | $122,200 |
| 2017 | $3,038 | $168,300 | $46,100 | $122,200 |
| 2016 | $2,807 | $166,100 | $46,100 | $120,000 |
| 2015 | $2,790 | $166,100 | $46,100 | $120,000 |
Source: Public Records
Map
Nearby Homes
- 33 Williams St
- 10 Deerfield Ave Unit 5
- 10 Deerfield Ave Unit 2
- 105 - 107 Bridge St
- 102 Elm St
- 2151 Route 2
- 2155 Massachusetts 2
- 7 Hog Hollow Rd
- 156 Ashfield Rd
- 31 W Oxbow Rd
- 24 W Oxbow Rd
- 0 Upper St
- 0 W Oxbow Rd Unit 73453651
- 3+5 Church St
- 0 Ashfield Rd
- 143 Charlemont Rd
- 0 Fiske Mill Rd
- 85 Dacey Rd
- lot 1 Shelburne Falls Rd
- 240 Beldingville Rd