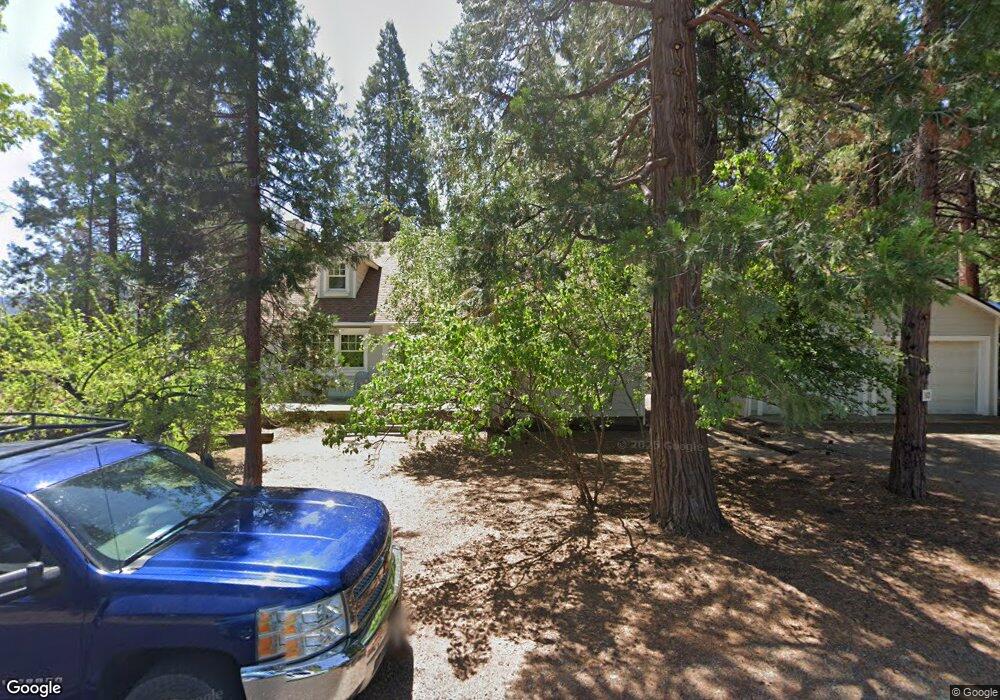
380 Azalea Dr Trinity Center, CA 96091
Estimated Value: $386,000 - $596,000
4
Beds
3
Baths
2,672
Sq Ft
$177/Sq Ft
Est. Value
About This Home
This home is located at 380 Azalea Dr, Trinity Center, CA 96091 and is currently estimated at $471,723, approximately $176 per square foot. 380 Azalea Dr is a home with nearby schools including Trinity Center Elementary, Weaverville Elementary School, and Trinity High School.
Ownership History
Date
Name
Owned For
Owner Type
Purchase Details
Closed on
Jan 9, 2024
Sold by
Sacco Sam and Naylor Denise
Bought by
Sacco Naylor Family Trust and Sacco
Current Estimated Value
Purchase Details
Closed on
Sep 22, 2005
Sold by
Bunce Robert A and Bunce Carol Anne
Bought by
Sacco Sam and Naylor Denise
Home Financials for this Owner
Home Financials are based on the most recent Mortgage that was taken out on this home.
Original Mortgage
$177,500
Interest Rate
5.7%
Mortgage Type
Seller Take Back
Create a Home Valuation Report for This Property
The Home Valuation Report is an in-depth analysis detailing your home's value as well as a comparison with similar homes in the area
Purchase History
| Date | Buyer | Sale Price | Title Company |
|---|---|---|---|
| Sacco Naylor Family Trust | -- | None Listed On Document | |
| Sacco Sam | $300,000 | First American Title Co |
Source: Public Records
Mortgage History
| Date | Status | Borrower | Loan Amount |
|---|---|---|---|
| Previous Owner | Sacco Sam | $177,500 |
Source: Public Records
Tax History
| Year | Tax Paid | Tax Assessment Tax Assessment Total Assessment is a certain percentage of the fair market value that is determined by local assessors to be the total taxable value of land and additions on the property. | Land | Improvement |
|---|---|---|---|---|
| 2025 | $4,127 | $409,953 | $54,652 | $355,301 |
| 2024 | $4,057 | $401,916 | $53,581 | $348,335 |
| 2023 | $4,057 | $394,036 | $52,531 | $341,505 |
| 2022 | $3,960 | $386,310 | $51,501 | $334,809 |
| 2021 | $3,893 | $378,737 | $50,492 | $328,245 |
| 2020 | $3,837 | $374,855 | $49,975 | $324,880 |
| 2019 | $3,762 | $367,506 | $48,996 | $318,510 |
| 2018 | $3,638 | $360,301 | $48,036 | $312,265 |
| 2017 | $3,627 | $353,238 | $47,095 | $306,143 |
| 2016 | $3,483 | $346,313 | $46,172 | $300,141 |
| 2015 | $3,429 | $341,112 | $45,479 | $295,633 |
| 2014 | $3,380 | $334,431 | $44,589 | $289,842 |
Source: Public Records
Map
Nearby Homes
- 220 & 230 Lakeview
- 230 N Lakeview Dr
- 220 & 230 Lakeview Dr
- 71 Mary
- 250 Mary Ave
- 230 Mary Ave
- 268 Placer Dr
- 279 Placer Dr
- 8341 E Side Rd
- 8341 E East Side Rd
- 10 Estabrook Ln
- 151 Guy Covington Dr
- 490 Bear Paw Trail
- 141 Mountain Aire Rd
- 121, 141 Mountain Aire Rd
- 121 Mountain Aire Ln
- 410 Lake Forest Dr
- 399 & 410 Lake Forest Dr
- 399 & 410 Lake Forest
- 750 & 798 Lake Forest Dr
Your Personal Tour Guide
Ask me questions while you tour the home.