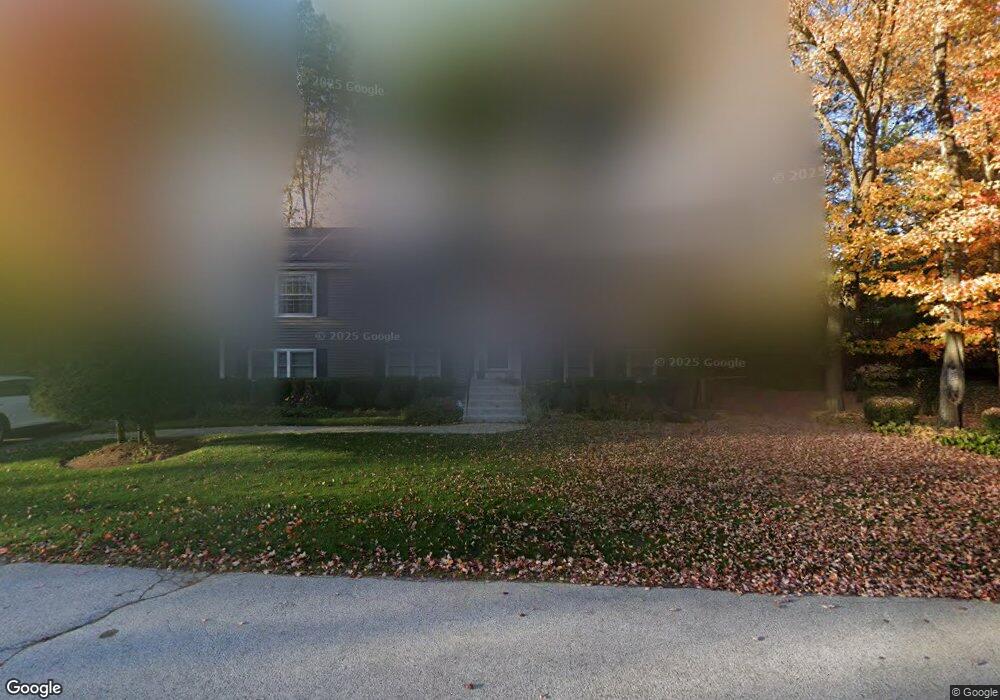
380 N Gate Rd Manchester, NH 03104
Estimated Value: $537,072 - $596,000
3
Beds
2
Baths
1,352
Sq Ft
$415/Sq Ft
Est. Value
About This Home
This home is located at 380 N Gate Rd, Manchester, NH 03104 and is currently estimated at $561,268, approximately $415 per square foot. 380 N Gate Rd is a home located in Hillsborough County with nearby schools including Webster School, Hillside Middle School, and Kreiva Academy Public Charter School (H).
Ownership History
Date
Name
Owned For
Owner Type
Purchase Details
Closed on
Aug 7, 2023
Sold by
Pamela Englander Ret and Englander
Bought by
Englander Pamela and Englander Luis
Current Estimated Value
Purchase Details
Closed on
Jul 10, 2023
Sold by
Englander Pamela and Englander Luis
Bought by
Englander Ft and Englander
Purchase Details
Closed on
Jun 28, 1999
Sold by
Foye Gary F and Foye Mary L
Bought by
Englander Luis S
Home Financials for this Owner
Home Financials are based on the most recent Mortgage that was taken out on this home.
Original Mortgage
$174,750
Interest Rate
7.09%
Mortgage Type
Purchase Money Mortgage
Create a Home Valuation Report for This Property
The Home Valuation Report is an in-depth analysis detailing your home's value as well as a comparison with similar homes in the area
Home Values in the Area
Average Home Value in this Area
Purchase History
| Date | Buyer | Sale Price | Title Company |
|---|---|---|---|
| Englander Pamela | -- | None Available | |
| Englander Ft | -- | None Available | |
| Englander Luis S | $174,900 | -- |
Source: Public Records
Mortgage History
| Date | Status | Borrower | Loan Amount |
|---|---|---|---|
| Previous Owner | Englander Luis S | $174,750 |
Source: Public Records
Tax History Compared to Growth
Tax History
| Year | Tax Paid | Tax Assessment Tax Assessment Total Assessment is a certain percentage of the fair market value that is determined by local assessors to be the total taxable value of land and additions on the property. | Land | Improvement |
|---|---|---|---|---|
| 2024 | $7,644 | $390,400 | $125,600 | $264,800 |
| 2023 | $7,363 | $390,400 | $125,600 | $264,800 |
| 2022 | $7,121 | $390,400 | $125,600 | $264,800 |
| 2021 | $6,902 | $390,400 | $125,600 | $264,800 |
| 2020 | $6,811 | $276,200 | $97,100 | $179,100 |
| 2019 | $6,717 | $276,200 | $97,100 | $179,100 |
| 2018 | $6,540 | $276,200 | $97,100 | $179,100 |
| 2017 | $6,441 | $276,200 | $97,100 | $179,100 |
| 2016 | $6,391 | $276,200 | $97,100 | $179,100 |
| 2015 | $6,280 | $267,900 | $86,700 | $181,200 |
| 2014 | $6,296 | $267,900 | $86,700 | $181,200 |
| 2013 | $6,073 | $267,900 | $86,700 | $181,200 |
Source: Public Records
Map
Nearby Homes
- 212 Kearney St
- 190 Chase Way
- 6 Deerhead St
- 755 Straw Hill Rd
- 45 Leonard Ave
- 118 Madeline Rd
- 117 Arthur Ave
- 541 Pickering St
- 128 Mammoth Rd Unit 122
- 221 Elgin Ave
- 126 Mammoth Rd Unit 1
- 136 Mammoth Rd Unit 628
- 1515 Belmont St
- 130 Golfview Dr
- 29 Golden Gate Dr
- 2143 Elm St
- 75 W Haven Rd
- 27 Martins Ferry Rd
- 2108 Elm St
- 490 River Rd Unit 13
- 400 N Gate Rd
- 358 N Gate Rd
- 169 Wellesley St
- 183 Wellesley St
- 381 N Gate Rd
- 155 Wellesley St
- 361 N Gate Rd
- 401 N Gate Rd
- 340 N Gate Rd
- 396 N Bend Dr
- 418 N Gate Rd
- 141 Wellesley St
- 414 N Bend Dr
- 414 N Bend Dr Unit 561A/9
- 376 N Bend Dr
- 341 N Gate Rd
- 421 N Gate Rd
- 60 Vassar St
- 170 Wellesley St
- 156 Wellesley St