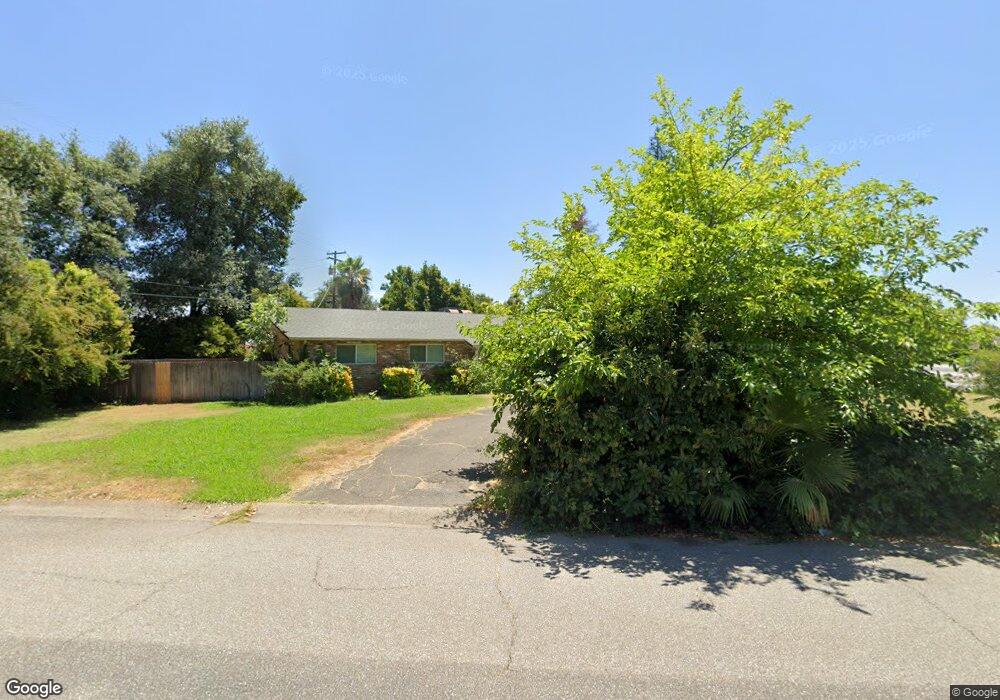
3807 Loustalot Way Redding, CA 96002
South Bechelli NeighborhoodEstimated Value: $335,000 - $379,000
3
Beds
2
Baths
1,654
Sq Ft
$217/Sq Ft
Est. Value
About This Home
This home is located at 3807 Loustalot Way, Redding, CA 96002 and is currently estimated at $358,512, approximately $216 per square foot. 3807 Loustalot Way is a home located in Shasta County with nearby schools including Lassen View Elementary School, Parsons Junior High School, and Enterprise High School.
Ownership History
Date
Name
Owned For
Owner Type
Purchase Details
Closed on
May 10, 2021
Sold by
Hill David G and Hill Christine J
Bought by
Hill David G and Hill Christine J
Current Estimated Value
Purchase Details
Closed on
Nov 3, 2011
Sold by
Aurora Loan Services Llc
Bought by
Hill David George and Hill Christine Jean
Purchase Details
Closed on
Aug 3, 2011
Sold by
Nelson Carol Denise and Nelson David Alan
Bought by
Aurora Loan Services Llc
Purchase Details
Closed on
Feb 8, 2002
Sold by
Sabine Virginia F
Bought by
Nelson David Alan and Nelson Carol Denise
Home Financials for this Owner
Home Financials are based on the most recent Mortgage that was taken out on this home.
Original Mortgage
$154,500
Interest Rate
7.13%
Mortgage Type
VA
Create a Home Valuation Report for This Property
The Home Valuation Report is an in-depth analysis detailing your home's value as well as a comparison with similar homes in the area
Home Values in the Area
Average Home Value in this Area
Purchase History
| Date | Buyer | Sale Price | Title Company |
|---|---|---|---|
| Hill David G | -- | None Available | |
| Hill David George | $125,000 | Lsi Title Company | |
| Aurora Loan Services Llc | $294,908 | Accommodation | |
| Nelson David Alan | $150,000 | First American Title Co |
Source: Public Records
Mortgage History
| Date | Status | Borrower | Loan Amount |
|---|---|---|---|
| Previous Owner | Nelson David Alan | $154,500 |
Source: Public Records
Tax History
| Year | Tax Paid | Tax Assessment Tax Assessment Total Assessment is a certain percentage of the fair market value that is determined by local assessors to be the total taxable value of land and additions on the property. | Land | Improvement |
|---|---|---|---|---|
| 2025 | $1,725 | $156,994 | $37,676 | $119,318 |
| 2024 | $1,701 | $153,917 | $36,938 | $116,979 |
| 2023 | $1,701 | $150,900 | $36,214 | $114,686 |
| 2022 | $1,653 | $147,942 | $35,504 | $112,438 |
| 2021 | $1,596 | $145,042 | $34,808 | $110,234 |
| 2020 | $1,589 | $143,556 | $34,452 | $109,104 |
| 2019 | $1,576 | $140,742 | $33,777 | $106,965 |
| 2018 | $1,558 | $137,983 | $33,115 | $104,868 |
| 2017 | $1,585 | $135,278 | $32,466 | $102,812 |
| 2016 | $1,483 | $132,627 | $31,830 | $100,797 |
| 2015 | $1,471 | $130,635 | $31,352 | $99,283 |
| 2014 | $1,461 | $128,077 | $30,738 | $97,339 |
Source: Public Records
Map
Nearby Homes
- 3708 Traverse St
- 688 Julie Way
- 3650 Cheryl Dr
- 737 Estate St
- 607 Woodacre Dr
- 723 Woodacre Dr
- 1209 C St
- 751 Woodacre Dr
- 1115 2nd St
- 3527 Adams Ln
- 1108 4th St
- 3428 Adams Ln
- 952 Camino Ct
- 4323 Churn Crk Rd
- 5367 Rosswood Ln
- 3703 Harrow Ct
- 3857 Eagle Pkwy
- 1354 Harpole Rd
- 1091 Del Sol Place
- 0 Lot4 Unit 2 Ph 2 Stillwater Unit 25-4962
- 3829 Loustalot Way
- 531 Joaquin Ave
- 506 Joaquin Ave
- 540 Gary Ct
- 3845 Loustalot Way
- 530 Joaquin Ave
- 3910 Bechelli Ln Unit 1
- 3910 Bechelli Ln
- 3874 Bechelli Ln
- 3747 Loustalot Way
- 531 Gary Ct Unit 1
- 531 Gary Ct
- 3932 Bechelli Ln
- 3750 Suzanne Way
- 3867 Loustalot Way
- 569 Joaquin Ave
- 3844 Bechelli Ln
- 570 Gary Ct
- 3771 Suzanne Way
- 3903 Cheryl Dr
Your Personal Tour Guide
Ask me questions while you tour the home.