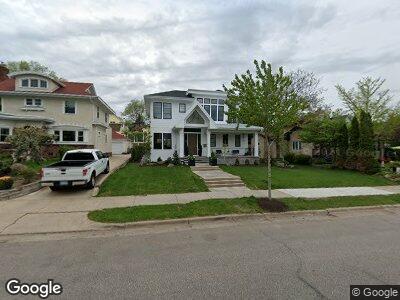
3810 Sheridan Ave S Minneapolis, MN 55410
Linden Hills NeighborhoodEstimated Value: $1,506,000 - $1,976,370
3
Beds
3
Baths
2,829
Sq Ft
$599/Sq Ft
Est. Value
About This Home
This home is located at 3810 Sheridan Ave S, Minneapolis, MN 55410 and is currently estimated at $1,695,593, approximately $599 per square foot. 3810 Sheridan Ave S is a home located in Hennepin County with nearby schools including Lake Harriet Lower Elementary School, Lake Harriet Upper School, and Anthony Middle School.
Ownership History
Date
Name
Owned For
Owner Type
Purchase Details
Closed on
Nov 20, 2023
Sold by
Wolfenson Ellyn and Wolfenson Michael B
Bought by
Ellyn J Wolfenson Revocable Trust and Wolfenson
Current Estimated Value
Purchase Details
Closed on
Jan 3, 2019
Sold by
Belzer Michael Barden and Wolfenson Ellyn J
Bought by
Wolfenson Ellyn J
Purchase Details
Closed on
Jun 10, 2016
Sold by
Bouza Anthony V and Bouza Vivien E
Bought by
Belzer Michael Bardin and Wolfenson Ellyn J
Home Financials for this Owner
Home Financials are based on the most recent Mortgage that was taken out on this home.
Original Mortgage
$269,580
Interest Rate
3.75%
Mortgage Type
Adjustable Rate Mortgage/ARM
Purchase Details
Closed on
Dec 28, 2015
Sold by
Bouza Dominic and Bouza Amy C
Bought by
Bouza Anthony and Bouza Vivien E
Create a Home Valuation Report for This Property
The Home Valuation Report is an in-depth analysis detailing your home's value as well as a comparison with similar homes in the area
Home Values in the Area
Average Home Value in this Area
Purchase History
| Date | Buyer | Sale Price | Title Company |
|---|---|---|---|
| Ellyn J Wolfenson Revocable Trust | $500 | None Listed On Document | |
| Wolfenson Ellyn J | -- | None Available | |
| Belzer Michael Bardin | $649,476 | Burnet Title | |
| Bouza Anthony | -- | Attorney |
Source: Public Records
Mortgage History
| Date | Status | Borrower | Loan Amount |
|---|---|---|---|
| Previous Owner | Wolfenson Ellyn J | $250,000 | |
| Previous Owner | Wolfenson Ellyn J | $440,500 | |
| Previous Owner | Wolfenson Ellyn J | $450,000 | |
| Previous Owner | Belzer Michael Bardin | $269,580 |
Source: Public Records
Tax History Compared to Growth
Tax History
| Year | Tax Paid | Tax Assessment Tax Assessment Total Assessment is a certain percentage of the fair market value that is determined by local assessors to be the total taxable value of land and additions on the property. | Land | Improvement |
|---|---|---|---|---|
| 2023 | $24,760 | $1,643,000 | $502,000 | $1,141,000 |
| 2022 | $23,437 | $1,559,000 | $478,000 | $1,081,000 |
| 2021 | $21,415 | $1,472,000 | $483,000 | $989,000 |
| 2020 | $17,863 | $1,400,000 | $471,900 | $928,100 |
| 2019 | $11,181 | $1,100,000 | $336,600 | $763,400 |
| 2018 | $10,090 | $704,500 | $336,600 | $367,900 |
| 2017 | $10,152 | $631,000 | $306,000 | $325,000 |
| 2016 | $10,801 | $631,000 | $306,000 | $325,000 |
| 2015 | $10,628 | $597,000 | $306,000 | $291,000 |
| 2014 | -- | $560,000 | $283,700 | $276,300 |
Source: Public Records
Map
Nearby Homes
- 3701 Upton Ave S
- 3750 W Bde Maka Ska Pkwy
- 3916 Thomas Ave S
- 3710 Vincent Ave S
- 3836 Vincent Ave S
- 3924 Upton Ave S
- 4001 Sheridan Ave S
- 3909 Xerxes Ave S
- 4006 Washburn Ave S
- 4102 Linden Hills Blvd
- 3933 Zenith Ave S
- 3823 Abbott Ave S
- 4136 Queen Ave S Unit 108
- 3800 Abbott Ave S
- 3742 Abbott Ave S
- 2815 W 42nd St
- 4200 Upton Ave S
- 4202 Upton Ave S
- 4236 Sheridan Ave S
- 4043 Abbott Ave S
- 3810 Sheridan Ave S
- 3806 Sheridan Ave S
- 3800 Sheridan Ave S
- 3809 Thomas Ave S
- 3807 Thomas Ave S
- 3803 Thomas Ave S
- 3817 Thomas Ave S
- 3819 Thomas Ave S
- 3822 Sheridan Ave S
- 3721 Thomas Ave S
- 3823 Thomas Ave S
- 3815 Sheridan Ave S
- 3790 W Bde Maka Ska Pkwy
- 3790 W Calhoun Pkwy
- 3802 W Calhoun Pkwy
- 3811 Sheridan Ave S
- 3825 Thomas Ave S
- 3719 Thomas Ave S
- 3827 Thomas Ave S
- 3817 Sheridan Ave S