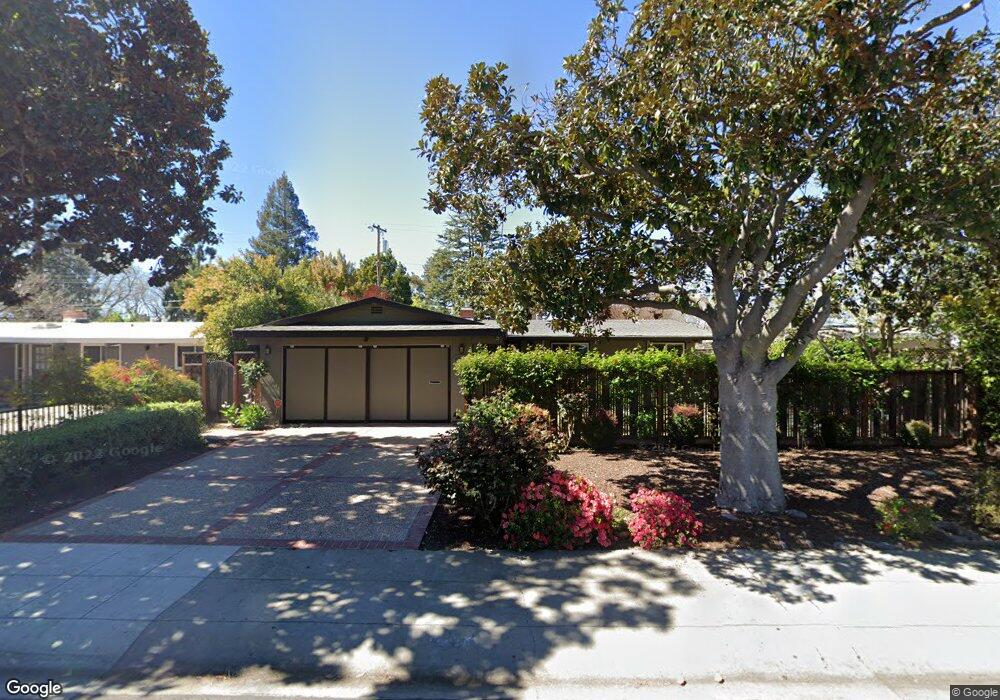
3814 Nathan Way Palo Alto, CA 94303
Adobe Meadow-Meadow Park NeighborhoodEstimated Value: $3,056,294 - $3,262,000
3
Beds
2
Baths
1,421
Sq Ft
$2,215/Sq Ft
Est. Value
About This Home
This home is located at 3814 Nathan Way, Palo Alto, CA 94303 and is currently estimated at $3,146,824, approximately $2,214 per square foot. 3814 Nathan Way is a home located in Santa Clara County with nearby schools including Fairmeadow Elementary School, Jane Lathrop Stanford Middle School, and Henry M. Gunn High School.
Ownership History
Date
Name
Owned For
Owner Type
Purchase Details
Closed on
Mar 5, 2015
Sold by
Araujo Irene N G
Bought by
Araujo Irene N G
Current Estimated Value
Purchase Details
Closed on
Mar 4, 2015
Sold by
Araujo Irene N G
Bought by
Araujo Irene N G
Purchase Details
Closed on
Nov 9, 1998
Sold by
Araujo Fausto G and Araujo Irene N
Bought by
Araujo Fausto G and Araujo Irene N G
Create a Home Valuation Report for This Property
The Home Valuation Report is an in-depth analysis detailing your home's value as well as a comparison with similar homes in the area
Home Values in the Area
Average Home Value in this Area
Purchase History
| Date | Buyer | Sale Price | Title Company |
|---|---|---|---|
| Araujo Irene N G | -- | None Available | |
| Araujo Irene N G | -- | None Available | |
| Araujo Fausto G | -- | -- |
Source: Public Records
Tax History Compared to Growth
Tax History
| Year | Tax Paid | Tax Assessment Tax Assessment Total Assessment is a certain percentage of the fair market value that is determined by local assessors to be the total taxable value of land and additions on the property. | Land | Improvement |
|---|---|---|---|---|
| 2025 | $5,093 | $360,981 | $165,728 | $195,253 |
| 2024 | $5,093 | $353,904 | $162,479 | $191,425 |
| 2023 | $5,012 | $346,966 | $159,294 | $187,672 |
| 2022 | $4,944 | $340,164 | $156,171 | $183,993 |
| 2021 | $4,844 | $333,495 | $153,109 | $180,386 |
| 2020 | $4,759 | $330,077 | $151,540 | $178,537 |
| 2019 | $4,700 | $323,606 | $148,569 | $175,037 |
| 2018 | $4,588 | $317,261 | $145,656 | $171,605 |
| 2017 | $4,505 | $311,041 | $142,800 | $168,241 |
| 2016 | $4,380 | $304,943 | $140,000 | $164,943 |
| 2015 | $4,330 | $300,364 | $137,898 | $162,466 |
| 2014 | $4,154 | $294,481 | $135,197 | $159,284 |
Source: Public Records
Map
Nearby Homes
- 3839 Ross Rd
- 3482 Kenneth Dr
- 701 Christine Dr
- 4148 Byron St
- 2045 Atlas Loop
- 4225 Park Blvd
- 748 Cottage Ct
- 853B Sierra Vista Ave
- 278 Monroe Dr Unit 8
- Plan 4 at 28FIFTY
- Plan 2 at 28FIFTY
- Plan 3 at 28FIFTY
- Plan 1 at 28FIFTY
- 1125 Esther Ct
- 1129 Esther Ct
- 342 Carolina Ln
- 2483 Whitney Dr
- 2760 Byron St
- 2255 Showers Dr Unit 111
- 1031 Amarillo Ave
- 3820 Nathan Way
- 3810 Nathan Way
- 3813 Louis Rd
- 3819 Louis Rd
- 3804 Nathan Way
- 3805 Louis Rd
- 3826 Nathan Way
- 3811 Nathan Way
- 3815 Nathan Way
- 3825 Louis Rd
- 3807 Nathan Way
- 3821 Nathan Way
- 3797 Louis Rd
- 3798 Nathan Way
- 3832 Nathan Way
- 3803 Nathan Way
- 3827 Nathan Way
- 3831 Louis Rd
- 3788 Nathan Way
- 3787 Louis Rd