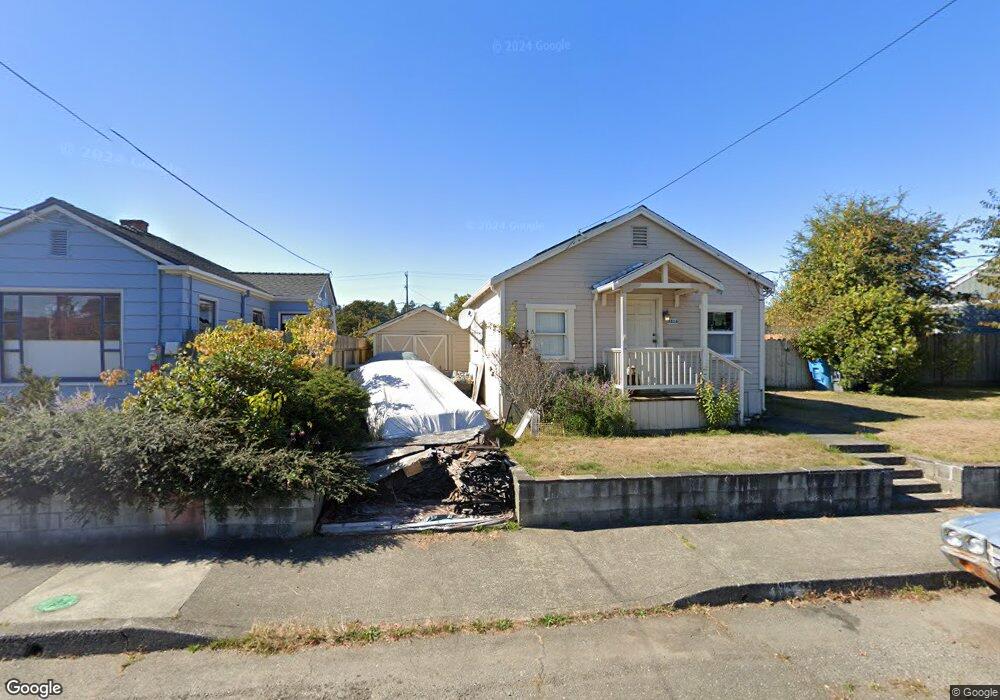
3816 G St Eureka, CA 95503
Rosewood NeighborhoodEstimated Value: $329,000 - $408,000
2
Beds
1
Bath
1,227
Sq Ft
$300/Sq Ft
Est. Value
About This Home
This home is located at 3816 G St, Eureka, CA 95503 and is currently estimated at $368,669, approximately $300 per square foot. 3816 G St is a home located in Humboldt County with nearby schools including Grant Elementary School, Winship Middle School, and Eureka Senior High School.
Ownership History
Date
Name
Owned For
Owner Type
Purchase Details
Closed on
Oct 31, 2007
Sold by
Micheals Alexandra and Czerkie Robert
Bought by
Czerkie Robert T and Micheals Alexandra
Current Estimated Value
Home Financials for this Owner
Home Financials are based on the most recent Mortgage that was taken out on this home.
Original Mortgage
$271,000
Outstanding Balance
$170,666
Interest Rate
6.29%
Mortgage Type
Stand Alone Refi Refinance Of Original Loan
Estimated Equity
$198,003
Purchase Details
Closed on
Jun 15, 2005
Sold by
Wood Donald
Bought by
Czerkie Robert and Micheals Alexandra
Home Financials for this Owner
Home Financials are based on the most recent Mortgage that was taken out on this home.
Original Mortgage
$208,000
Interest Rate
5.55%
Mortgage Type
Purchase Money Mortgage
Create a Home Valuation Report for This Property
The Home Valuation Report is an in-depth analysis detailing your home's value as well as a comparison with similar homes in the area
Home Values in the Area
Average Home Value in this Area
Purchase History
| Date | Buyer | Sale Price | Title Company |
|---|---|---|---|
| Czerkie Robert T | -- | First American Title Co | |
| Czerkie Robert | $260,000 | First American Title Ins Co |
Source: Public Records
Mortgage History
| Date | Status | Borrower | Loan Amount |
|---|---|---|---|
| Open | Czerkie Robert T | $271,000 | |
| Previous Owner | Czerkie Robert | $208,000 |
Source: Public Records
Tax History
| Year | Tax Paid | Tax Assessment Tax Assessment Total Assessment is a certain percentage of the fair market value that is determined by local assessors to be the total taxable value of land and additions on the property. | Land | Improvement |
|---|---|---|---|---|
| 2025 | $3,580 | $355,294 | $143,483 | $211,811 |
| 2024 | $3,580 | $348,328 | $140,670 | $207,658 |
| 2023 | $3,529 | $341,499 | $137,912 | $203,587 |
| 2022 | $3,662 | $334,804 | $135,208 | $199,596 |
| 2021 | $3,428 | $328,240 | $132,557 | $195,683 |
| 2020 | $3,401 | $324,875 | $131,198 | $193,677 |
| 2019 | $3,330 | $318,506 | $128,626 | $189,880 |
| 2018 | $3,279 | $312,261 | $126,104 | $186,157 |
| 2017 | $3,261 | $306,139 | $123,632 | $182,507 |
| 2016 | $3,260 | $300,137 | $121,208 | $178,929 |
| 2015 | $3,230 | $295,630 | $119,388 | $176,242 |
| 2014 | $3,018 | $289,840 | $117,050 | $172,790 |
Source: Public Records
Map
Nearby Homes
Your Personal Tour Guide
Ask me questions while you tour the home.