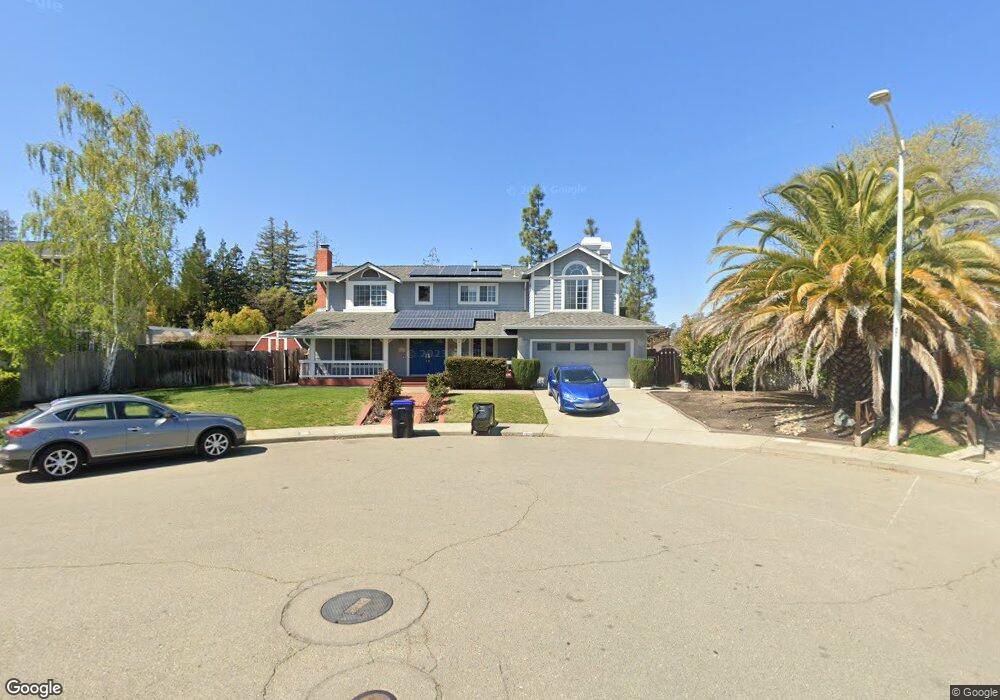
3826 Pinot Ct Pleasanton, CA 94566
Vintage Hills NeighborhoodEstimated Value: $1,794,000 - $2,105,000
4
Beds
3
Baths
2,476
Sq Ft
$780/Sq Ft
Est. Value
About This Home
This home is located at 3826 Pinot Ct, Pleasanton, CA 94566 and is currently estimated at $1,931,783, approximately $780 per square foot. 3826 Pinot Ct is a home located in Alameda County with nearby schools including Vintage Hills Elementary School, Pleasanton Middle School, and Amador Valley High School.
Ownership History
Date
Name
Owned For
Owner Type
Purchase Details
Closed on
Jun 1, 2018
Sold by
Landis Lawrence D and Landis Gina M
Bought by
Prakash Arun and Prakash Shivi
Current Estimated Value
Home Financials for this Owner
Home Financials are based on the most recent Mortgage that was taken out on this home.
Original Mortgage
$982,500
Outstanding Balance
$826,872
Interest Rate
3.37%
Mortgage Type
Adjustable Rate Mortgage/ARM
Estimated Equity
$1,104,911
Purchase Details
Closed on
Jul 23, 2012
Sold by
Landis Lawrence D and Landis Gina M
Bought by
Landis Lawrence D and Landis Gina M
Home Financials for this Owner
Home Financials are based on the most recent Mortgage that was taken out on this home.
Original Mortgage
$374,000
Interest Rate
3.62%
Mortgage Type
New Conventional
Purchase Details
Closed on
Oct 18, 2011
Sold by
Landis Lawrence D and Landis Gina M
Bought by
Landis Lawrence D and Landis Gina M
Home Financials for this Owner
Home Financials are based on the most recent Mortgage that was taken out on this home.
Original Mortgage
$383,000
Interest Rate
3.26%
Mortgage Type
New Conventional
Purchase Details
Closed on
Sep 27, 2010
Sold by
Landis Lawrence and Landis Gina
Bought by
Landis Lawrence D and Landis Gina M
Purchase Details
Closed on
Mar 3, 2009
Sold by
Landis Lawrence D and Landis Gina M
Bought by
Landis Lawrence D and Landis Gina M
Home Financials for this Owner
Home Financials are based on the most recent Mortgage that was taken out on this home.
Original Mortgage
$417,000
Interest Rate
5.03%
Mortgage Type
New Conventional
Purchase Details
Closed on
May 24, 2006
Sold by
Landis Lawrence and Landis Gina
Bought by
Landis Lawrence D and Landis Gina M
Purchase Details
Closed on
Jul 22, 2002
Sold by
Landis Gina and Landis Lawrence
Bought by
Landis Lawrence and Landis Gina
Home Financials for this Owner
Home Financials are based on the most recent Mortgage that was taken out on this home.
Original Mortgage
$198,500
Interest Rate
6.7%
Purchase Details
Closed on
Feb 23, 1994
Sold by
Oconnor Brian A and Oconnor Betty J
Bought by
Landis Lawrence and Landis Gina
Home Financials for this Owner
Home Financials are based on the most recent Mortgage that was taken out on this home.
Original Mortgage
$249,000
Interest Rate
6.98%
Create a Home Valuation Report for This Property
The Home Valuation Report is an in-depth analysis detailing your home's value as well as a comparison with similar homes in the area
Home Values in the Area
Average Home Value in this Area
Purchase History
| Date | Buyer | Sale Price | Title Company |
|---|---|---|---|
| Prakash Arun | $1,310,000 | Old Republic Title Company | |
| Landis Lawrence D | -- | North American Title Co Inc | |
| Landis Lawrence D | -- | North American Title Co Inc | |
| Landis Lawrence D | -- | North American Title Company | |
| Landis Lawrence D | -- | North American Title Company | |
| Landis Lawrence D | -- | Chicago Title Company | |
| Landis Lawrence D | -- | Old Republic Title Company | |
| Landis Lawrence D | -- | Old Republic Title Company | |
| Landis Lawrence D | -- | None Available | |
| Landis Lawrence | -- | North American Title Co | |
| Landis Lawrence | $333,000 | First American Title Guarant |
Source: Public Records
Mortgage History
| Date | Status | Borrower | Loan Amount |
|---|---|---|---|
| Open | Prakash Arun | $982,500 | |
| Previous Owner | Landis Lawrence D | $374,000 | |
| Previous Owner | Landis Lawrence D | $383,000 | |
| Previous Owner | Landis Lawrence D | $417,000 | |
| Previous Owner | Landis Lawrence | $198,500 | |
| Previous Owner | Landis Lawrence | $249,000 |
Source: Public Records
Tax History
| Year | Tax Paid | Tax Assessment Tax Assessment Total Assessment is a certain percentage of the fair market value that is determined by local assessors to be the total taxable value of land and additions on the property. | Land | Improvement |
|---|---|---|---|---|
| 2025 | $17,180 | $1,490,530 | $447,159 | $1,043,371 |
| 2024 | $17,180 | $1,461,304 | $438,391 | $1,022,913 |
| 2023 | $16,985 | $1,432,654 | $429,796 | $1,002,858 |
| 2022 | $16,090 | $1,404,568 | $421,370 | $983,198 |
| 2021 | $15,678 | $1,377,031 | $413,109 | $963,922 |
| 2020 | $15,478 | $1,362,923 | $408,877 | $954,046 |
| 2019 | $15,669 | $1,336,200 | $400,860 | $935,340 |
| 2018 | $5,801 | $497,414 | $149,224 | $348,190 |
| 2017 | $5,652 | $487,664 | $146,299 | $341,365 |
| 2016 | $5,215 | $478,104 | $143,431 | $334,673 |
| 2015 | $5,117 | $470,924 | $141,277 | $329,647 |
| 2014 | $5,207 | $461,700 | $138,510 | $323,190 |
Source: Public Records
Map
Nearby Homes
- 601 Palomino Dr Unit D
- 601 Palomino Dr Unit C
- 691 Concord Place
- 389 Mavis Dr
- 3375 Norton Way Unit 5
- 1282 Vintner Way
- 327 Linden Way
- 215 Mavis Dr
- 3845 Vineyard Ave Unit F
- 351 Christina Ct
- 3841 Vineyard Ave Unit 18
- 3839 Vineyard Ave Unit 45
- 3877 Vine St
- 3263 Vineyard Ave Unit 44
- 3263 Vineyard Ave Unit 68
- 3263 Vineyard Ave Unit 35
- 3263 Vineyard Ave Unit 62
- 3263 Vineyard Ave Unit 132
- 3263 Vineyard Ave Unit 89
- 3231 Vineyard Ave Unit 141
Your Personal Tour Guide
Ask me questions while you tour the home.