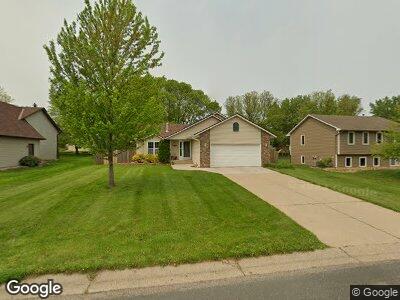
3827 Danbury Trail Saint Paul, MN 55123
Estimated Value: $381,000 - $428,000
3
Beds
3
Baths
1,144
Sq Ft
$352/Sq Ft
Est. Value
About This Home
This home is located at 3827 Danbury Trail, Saint Paul, MN 55123 and is currently estimated at $402,486, approximately $351 per square foot. 3827 Danbury Trail is a home located in Dakota County with nearby schools including Woodland Elementary School, Dakota Hills Middle School, and Eagan Senior High School.
Ownership History
Date
Name
Owned For
Owner Type
Purchase Details
Closed on
May 12, 2020
Sold by
Davern Michael R and Davern Kristyia E
Bought by
Davern Michael R and Davern Kristia E
Current Estimated Value
Home Financials for this Owner
Home Financials are based on the most recent Mortgage that was taken out on this home.
Original Mortgage
$208,000
Outstanding Balance
$188,396
Interest Rate
3.2%
Mortgage Type
New Conventional
Purchase Details
Closed on
Nov 28, 2005
Sold by
Zaun David A and Zaun Sarah E
Bought by
Davern Michael
Home Financials for this Owner
Home Financials are based on the most recent Mortgage that was taken out on this home.
Original Mortgage
$203,040
Interest Rate
6.2%
Mortgage Type
New Conventional
Purchase Details
Closed on
Jul 12, 2001
Sold by
Johnson Donald M and Johnson Jennifer M
Bought by
Zaun David A and Zaun Sarah E
Create a Home Valuation Report for This Property
The Home Valuation Report is an in-depth analysis detailing your home's value as well as a comparison with similar homes in the area
Home Values in the Area
Average Home Value in this Area
Purchase History
| Date | Buyer | Sale Price | Title Company |
|---|---|---|---|
| Davern Michael R | -- | Burnet Title | |
| Davern Michael | $253,800 | -- | |
| Zaun David A | $206,000 | -- |
Source: Public Records
Mortgage History
| Date | Status | Borrower | Loan Amount |
|---|---|---|---|
| Open | Davern Michael R | $208,000 | |
| Closed | Davern Michael R | $208,000 | |
| Previous Owner | Davern Michael R | $203,040 | |
| Previous Owner | Davern Michael R | $50,760 |
Source: Public Records
Tax History Compared to Growth
Tax History
| Year | Tax Paid | Tax Assessment Tax Assessment Total Assessment is a certain percentage of the fair market value that is determined by local assessors to be the total taxable value of land and additions on the property. | Land | Improvement |
|---|---|---|---|---|
| 2023 | $3,848 | $358,000 | $94,400 | $263,600 |
| 2022 | $3,316 | $341,800 | $94,200 | $247,600 |
| 2021 | $3,206 | $302,200 | $81,900 | $220,300 |
| 2020 | $3,146 | $286,400 | $78,000 | $208,400 |
| 2019 | $2,835 | $274,400 | $74,300 | $200,100 |
| 2018 | $2,605 | $262,400 | $70,800 | $191,600 |
| 2017 | $2,601 | $236,200 | $67,400 | $168,800 |
| 2016 | $2,565 | $226,100 | $64,200 | $161,900 |
| 2015 | $2,486 | $204,413 | $59,194 | $145,219 |
| 2014 | -- | $201,470 | $57,405 | $144,065 |
| 2013 | -- | $183,703 | $51,295 | $132,408 |
Source: Public Records
Map
Nearby Homes
- 1019 Briar Creek Rd
- 3698 Cardinal Way
- 3694 Cardinal Way
- 3664 Canary Way
- 3876 Westbury Ln
- 3865 Westbury Ln
- 886 Oak Ct
- 3655 Falcon Way
- 3848 Westbury Dr
- 3626 Springwood Ct
- 3866 Westbury Dr
- 3662 Wescott Hills Dr
- 3969 Northview Terrace
- 3861 Westbury Dr
- 3771 Woodland Trail
- 3664 Abbey Way Unit C
- 842 Bald Lake Ct
- 3744 Woodland Trail
- 3635 Saint Francis Way Unit A
- 831 Hidden Meadow Trail
- 3827 Danbury Trail
- 3819 Danbury Trail
- 3835 Danbury Trail
- 1015 Briar Creek Rd
- 1011 Briar Creek Rd
- 3843 Danbury Trail
- 3811 Danbury Trail
- 3830 Danbury Trail
- 1007 Briar Creek Rd
- 3838 Danbury Trail
- 1003 Stony Point Rd
- 3851 Danbury Trail
- 1023 Briar Creek Rd
- 1009 Danbury Ct
- 1003 Briar Creek Rd
- 999 Stony Point Rd
- 996 Stony Point Rd
- 1030 Briar Creek Rd
- 4913 Avery Ct
- 4900 Avery Ct