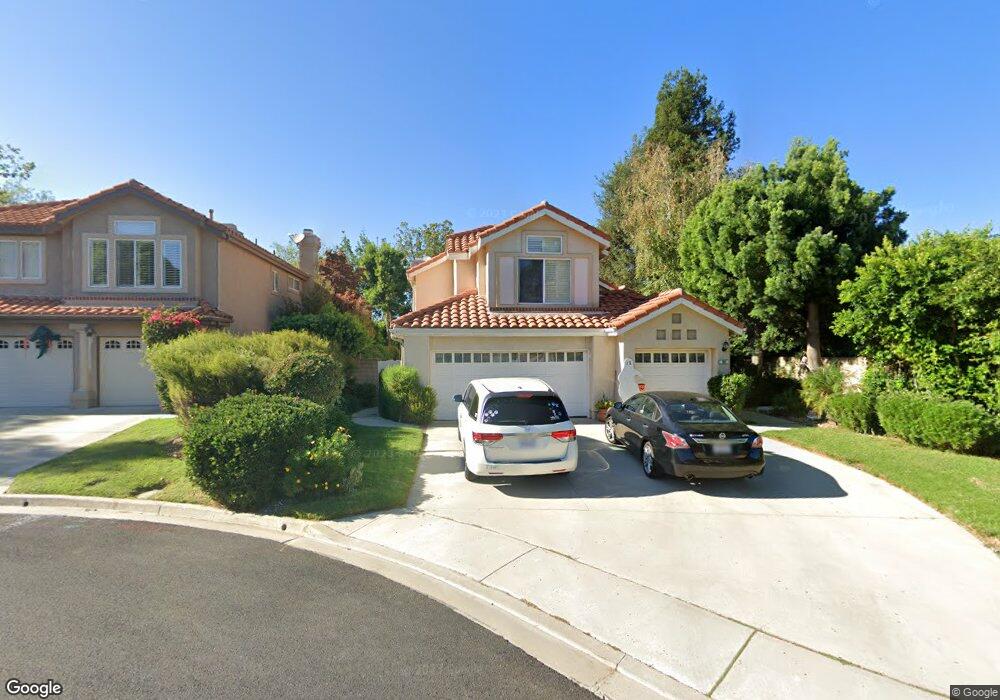
383 Hornblend Ct Simi Valley, CA 93065
Wood Ranch NeighborhoodEstimated Value: $1,028,899 - $1,151,000
4
Beds
3
Baths
2,495
Sq Ft
$443/Sq Ft
Est. Value
About This Home
This home is located at 383 Hornblend Ct, Simi Valley, CA 93065 and is currently estimated at $1,104,975, approximately $442 per square foot. 383 Hornblend Ct is a home located in Ventura County with nearby schools including Wood Ranch Elementary School, Sinaloa Middle School, and Royal High School.
Ownership History
Date
Name
Owned For
Owner Type
Purchase Details
Closed on
May 7, 2022
Sold by
Blume Family Trust
Bought by
Blume Family Trust
Current Estimated Value
Home Financials for this Owner
Home Financials are based on the most recent Mortgage that was taken out on this home.
Original Mortgage
$1,425,000
Outstanding Balance
$1,419,514
Interest Rate
5.1%
Estimated Equity
-$314,539
Purchase Details
Closed on
Oct 26, 2000
Sold by
Blume Cary W and Blume Bonita L
Bought by
Blume Cary W and Blume Bonita L
Purchase Details
Closed on
Jul 28, 2000
Sold by
Patrick Roney Kevin and Lynn Jennifer
Bought by
Blume Gary W and Blume Bonita L
Home Financials for this Owner
Home Financials are based on the most recent Mortgage that was taken out on this home.
Original Mortgage
$310,500
Interest Rate
7.75%
Purchase Details
Closed on
Mar 29, 1999
Sold by
Vandueck Randal L and Vandueck Sunie A
Bought by
Roney Kevin Patrick and Roney Jennifer Lynn
Home Financials for this Owner
Home Financials are based on the most recent Mortgage that was taken out on this home.
Original Mortgage
$296,000
Interest Rate
6.86%
Purchase Details
Closed on
Jul 1, 1994
Sold by
Hope Michael and Hope Kristin
Bought by
Vandueck Randal L and Vandueck Sunie Ann
Home Financials for this Owner
Home Financials are based on the most recent Mortgage that was taken out on this home.
Original Mortgage
$258,000
Interest Rate
8.57%
Create a Home Valuation Report for This Property
The Home Valuation Report is an in-depth analysis detailing your home's value as well as a comparison with similar homes in the area
Home Values in the Area
Average Home Value in this Area
Purchase History
| Date | Buyer | Sale Price | Title Company |
|---|---|---|---|
| Blume Family Trust | -- | Fnc Title | |
| Blume Cary W | -- | -- | |
| Blume Gary W | $414,000 | Stewart Title Company | |
| Roney Kevin Patrick | $376,000 | First American Title Ins Co | |
| Vandueck Randal L | $287,000 | Gateway Title Co |
Source: Public Records
Mortgage History
| Date | Status | Borrower | Loan Amount |
|---|---|---|---|
| Open | Blume Family Trust | $1,425,000 | |
| Closed | Blume Family Trust | $1,425,000 | |
| Previous Owner | Blume Gary W | $310,500 | |
| Previous Owner | Roney Kevin Patrick | $296,000 | |
| Previous Owner | Vandueck Randal L | $258,000 | |
| Closed | Roney Kevin Patrick | $55,500 | |
| Closed | Blume Gary W | $82,800 |
Source: Public Records
Tax History
| Year | Tax Paid | Tax Assessment Tax Assessment Total Assessment is a certain percentage of the fair market value that is determined by local assessors to be the total taxable value of land and additions on the property. | Land | Improvement |
|---|---|---|---|---|
| 2025 | $7,444 | $623,806 | $249,519 | $374,287 |
| 2024 | $7,444 | $611,575 | $244,626 | $366,949 |
| 2023 | $7,000 | $599,584 | $239,830 | $359,754 |
| 2022 | $6,983 | $587,828 | $235,128 | $352,700 |
| 2021 | $6,941 | $576,302 | $230,517 | $345,785 |
| 2020 | $6,803 | $570,395 | $228,154 | $342,241 |
| 2019 | $6,495 | $559,212 | $223,681 | $335,531 |
| 2018 | $6,446 | $548,248 | $219,296 | $328,952 |
| 2017 | $6,307 | $537,499 | $214,997 | $322,502 |
| 2016 | $6,026 | $526,961 | $210,782 | $316,179 |
| 2015 | $5,905 | $519,048 | $207,617 | $311,431 |
| 2014 | $5,827 | $508,883 | $203,551 | $305,332 |
Source: Public Records
Map
Nearby Homes
- 638 High Plains Ln
- 638 High Plains Ln Unit A
- 260 Sycamore Ridge St
- 713 Twillin Ct
- 190 Golden Glen Dr
- 545 Shadow Ln
- 2996 Eagles Claw Ave
- 3118 Foxtail Ct
- 271 Fieldstone Way Unit A
- 272 Fieldstone Way Unit A
- 455 Kennerick Ln
- 430 Fresh Meadows Rd
- 2980 Blazing Star Dr
- 440 Huyler Ln Unit C
- 286 Golden Fern Ct
- 847 Links View Dr
- 2457 Rutland Place
- 2449 Rutland Place
- 139 Park Hill Rd
- 3683 Mapleknoll Place
- 375 Hornblend Ct
- 397 Hornblend Ct
- 384 Cliffhollow Ct
- 376 Cliffhollow Ct
- 367 Hornblend Ct
- 368 Cliffhollow Ct
- 392 Cliffhollow Ct
- 359 Hornblend Ct
- 390 Hornblend Ct
- 374 Hornblend Ct
- 396 Hornblend Ct
- 366 Hornblend Ct
- 351 Hornblend Ct
- 352 Cliffhollow Ct
- 377 Cliffhollow Ct
- 358 Hornblend Ct
- 706 Arvada Ct
- 385 Cliffhollow Ct
- 343 Hornblend Ct
- 344 Cliffhollow Ct
Your Personal Tour Guide
Ask me questions while you tour the home.