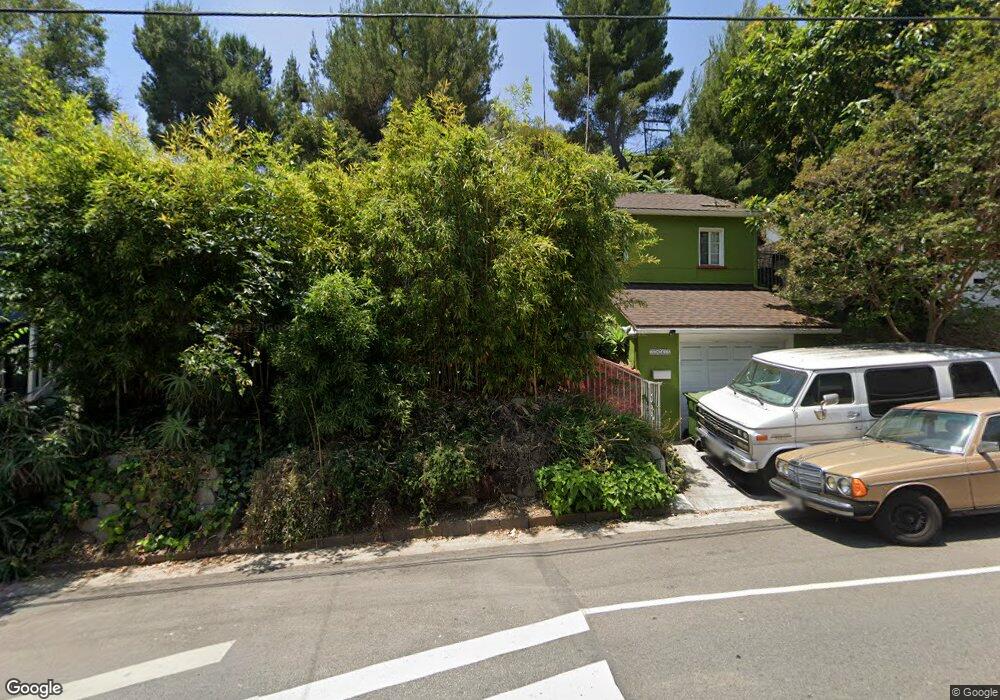
3843 Division St Los Angeles, CA 90065
Glassell Park NeighborhoodEstimated Value: $868,593 - $1,060,000
2
Beds
1
Bath
--
Sq Ft
6,534
Sq Ft Lot
About This Home
This home is located at 3843 Division St, Los Angeles, CA 90065 and is currently estimated at $947,148. 3843 Division St is a home located in Los Angeles County with nearby schools including Toland Way Elementary School, Benjamin Franklin High School, and Irving STEAM Magnet School.
Ownership History
Date
Name
Owned For
Owner Type
Purchase Details
Closed on
Jun 18, 2024
Sold by
Dea Samuel Zhen and Dea Miu-Li T
Bought by
Samuel And Miu-Li Dea Family Trust and Dea
Current Estimated Value
Purchase Details
Closed on
May 7, 1999
Sold by
Kaku Darryl K and Kaku Ilia N
Bought by
Dea Samuel Zhen
Home Financials for this Owner
Home Financials are based on the most recent Mortgage that was taken out on this home.
Original Mortgage
$110,600
Interest Rate
7.05%
Purchase Details
Closed on
Dec 15, 1995
Sold by
Federal National Mortgage Association
Bought by
Kaku Darryl K and Kaku Ilia N
Home Financials for this Owner
Home Financials are based on the most recent Mortgage that was taken out on this home.
Original Mortgage
$101,850
Interest Rate
7.38%
Mortgage Type
Seller Take Back
Purchase Details
Closed on
Aug 4, 1995
Sold by
Greer Douglas A and Greer Denise H
Bought by
Boston Harbor Corp
Purchase Details
Closed on
Jul 20, 1995
Sold by
Greer Douglas A and Greer Denise H
Bought by
Federal National Mortgage Association
Create a Home Valuation Report for This Property
The Home Valuation Report is an in-depth analysis detailing your home's value as well as a comparison with similar homes in the area
Home Values in the Area
Average Home Value in this Area
Purchase History
| Date | Buyer | Sale Price | Title Company |
|---|---|---|---|
| Samuel And Miu-Li Dea Family Trust | -- | None Listed On Document | |
| Dea Samuel Zhen | $139,500 | Orange Coast Title | |
| Kaku Darryl K | $105,000 | United Title | |
| Boston Harbor Corp | -- | -- | |
| Federal National Mortgage Association | $173,318 | First Southwestern Title |
Source: Public Records
Mortgage History
| Date | Status | Borrower | Loan Amount |
|---|---|---|---|
| Previous Owner | Dea Samuel Zhen | $110,600 | |
| Previous Owner | Kaku Darryl K | $101,850 |
Source: Public Records
Tax History Compared to Growth
Tax History
| Year | Tax Paid | Tax Assessment Tax Assessment Total Assessment is a certain percentage of the fair market value that is determined by local assessors to be the total taxable value of land and additions on the property. | Land | Improvement |
|---|---|---|---|---|
| 2025 | $2,745 | $218,667 | $150,016 | $68,651 |
| 2024 | $2,745 | $214,380 | $147,075 | $67,305 |
| 2023 | $2,694 | $210,178 | $144,192 | $65,986 |
| 2022 | $2,569 | $206,058 | $141,365 | $64,693 |
| 2021 | $2,535 | $202,019 | $138,594 | $63,425 |
| 2019 | $2,461 | $196,029 | $134,484 | $61,545 |
| 2018 | $2,439 | $192,187 | $131,848 | $60,339 |
| 2016 | $2,326 | $184,726 | $126,729 | $57,997 |
| 2015 | $2,293 | $181,952 | $124,826 | $57,126 |
| 2014 | $2,310 | $178,388 | $122,381 | $56,007 |
Source: Public Records
Map
Nearby Homes
- 3825 Cazador St
- 3781 Richardson Dr
- 4013 Division St
- 0 Barryknoll Dr Unit MB25202363
- 0 Barryknoll Dr Unit MB25140497
- 981 Nordica Dr
- 4537 Cleland Ave
- 1038 Oban Dr
- 3744 Parrish Ave
- 1070 N Oban Dr
- 1046 Oban Dr
- 3919 Barryknoll Dr
- 3701 Barryknoll Dr
- 3865 Barryknoll Dr
- 3861 Barryknoll Dr
- 3871 Barryknoll Dr
- 811 Oneonta Dr
- 2520 Hines Dr
- 2512 Hines Dr
- 4623 Jessica Dr
- 3849 Division St
- 3837 Division St
- 3853 Division St
- 3833 Division St
- 3859 Division St
- 3829 Division St
- 3846 Division St
- 3842 Division St
- 3838 Division St
- 3832 Division St
- 3825 Division St
- 3852 Division St
- 3863 Division St
- 3828 Division St
- 3858 Division St
- 3819 Division St
- 3822 Division St
- 3862 Division St
- 3877 Division St
- 3818 Division St