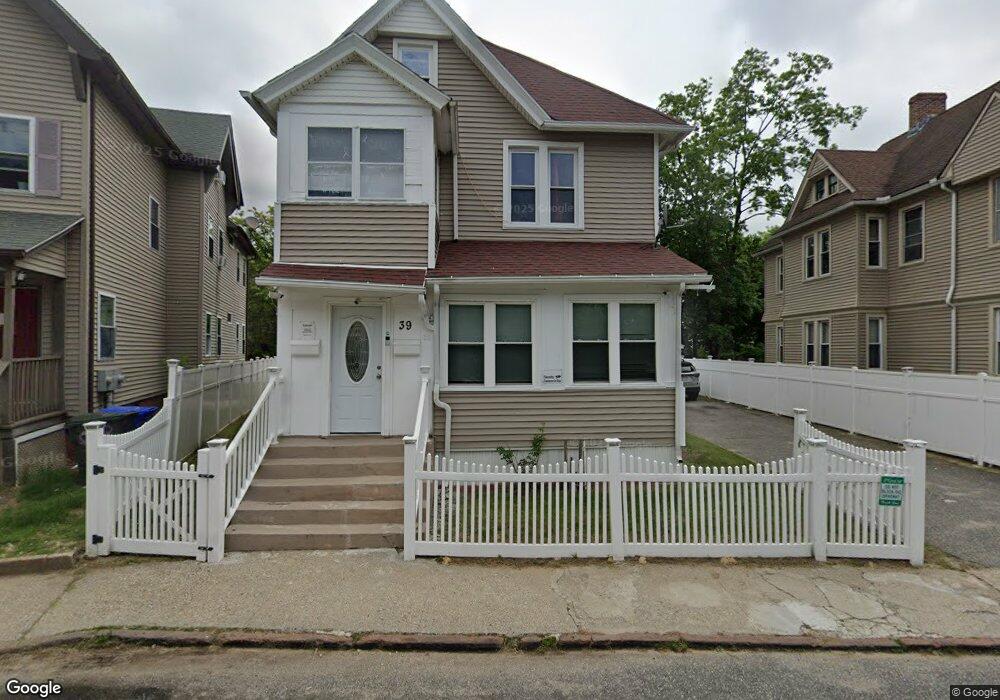
39 Beech St Springfield, MA 01105
Maple-High Six Corners NeighborhoodEstimated Value: $288,904 - $332,000
4
Beds
2
Baths
2,136
Sq Ft
$147/Sq Ft
Est. Value
About This Home
This home is located at 39 Beech St, Springfield, MA 01105 and is currently estimated at $313,726, approximately $146 per square foot. 39 Beech St is a home located in Hampden County with nearby schools including Milton Bradley School, M Marcus Kiley Middle, and High School Of Commerce.
Ownership History
Date
Name
Owned For
Owner Type
Purchase Details
Closed on
Jan 3, 2006
Sold by
Salgado Susetta
Bought by
Ramos Alfredo
Current Estimated Value
Home Financials for this Owner
Home Financials are based on the most recent Mortgage that was taken out on this home.
Original Mortgage
$130,500
Interest Rate
6.39%
Mortgage Type
Purchase Money Mortgage
Purchase Details
Closed on
Apr 5, 2001
Sold by
Ayala Angel M and Ayala Francisca
Bought by
Salgado Susetta
Home Financials for this Owner
Home Financials are based on the most recent Mortgage that was taken out on this home.
Original Mortgage
$66,457
Interest Rate
7.05%
Mortgage Type
Purchase Money Mortgage
Create a Home Valuation Report for This Property
The Home Valuation Report is an in-depth analysis detailing your home's value as well as a comparison with similar homes in the area
Home Values in the Area
Average Home Value in this Area
Purchase History
| Date | Buyer | Sale Price | Title Company |
|---|---|---|---|
| Ramos Alfredo | $145,000 | -- | |
| Salgado Susetta | $67,500 | -- |
Source: Public Records
Mortgage History
| Date | Status | Borrower | Loan Amount |
|---|---|---|---|
| Open | Salgado Susetta | $159,101 | |
| Closed | Ramos Alfredo | $130,500 | |
| Closed | Ramos Alfredo | $14,500 | |
| Previous Owner | Salgado Susetta | $66,457 | |
| Previous Owner | Salgado Susetta | $47,250 |
Source: Public Records
Tax History
| Year | Tax Paid | Tax Assessment Tax Assessment Total Assessment is a certain percentage of the fair market value that is determined by local assessors to be the total taxable value of land and additions on the property. | Land | Improvement |
|---|---|---|---|---|
| 2025 | $4,348 | $277,300 | $25,300 | $252,000 |
| 2024 | $4,055 | $252,500 | $23,600 | $228,900 |
| 2023 | $3,592 | $210,700 | $22,500 | $188,200 |
| 2022 | $4,110 | $218,400 | $20,500 | $197,900 |
| 2021 | $3,285 | $173,800 | $18,600 | $155,200 |
| 2020 | $3,060 | $156,700 | $18,600 | $138,100 |
| 2019 | $2,830 | $143,800 | $18,600 | $125,200 |
| 2018 | $2,690 | $136,700 | $18,600 | $118,100 |
| 2017 | $2,709 | $137,800 | $14,900 | $122,900 |
| 2016 | $2,328 | $118,400 | $14,900 | $103,500 |
| 2015 | $2,221 | $112,900 | $14,900 | $98,000 |
Source: Public Records
Map
Nearby Homes
Your Personal Tour Guide
Ask me questions while you tour the home.