Estimated Value: $485,000 - $561,000
2
Beds
2
Baths
1,904
Sq Ft
$269/Sq Ft
Est. Value
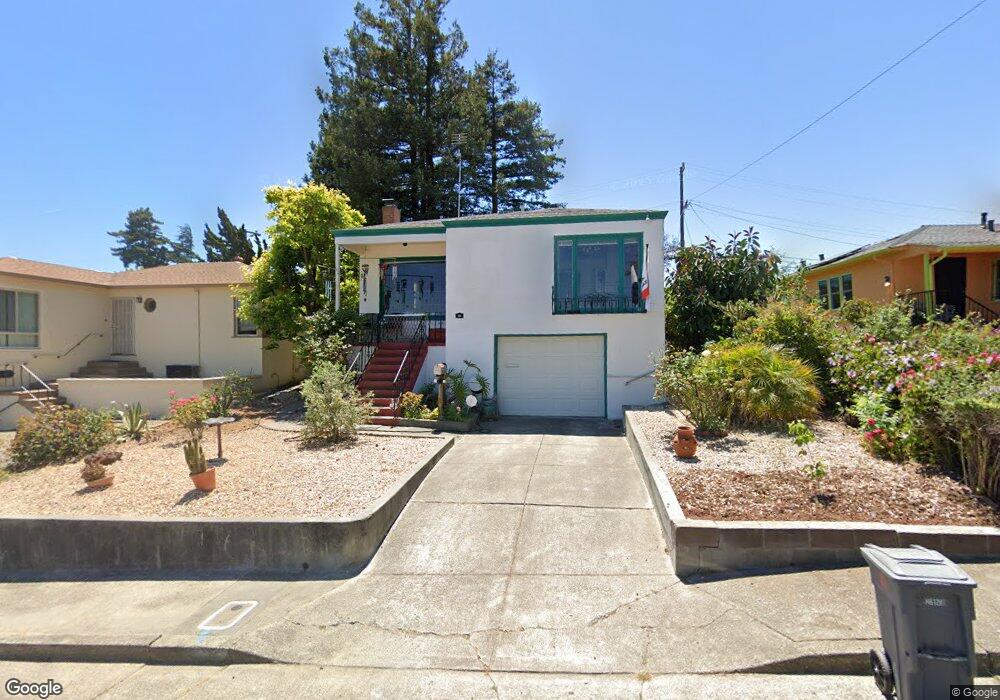
About This Home
This home is located at 39 D St, Vallejo, CA 94590 and is currently estimated at $511,537, approximately $268 per square foot. 39 D St is a home located in Solano County with nearby schools including Federal Terrace Elementary School, Vallejo High School, and Caliber: ChangeMakers Academy.
Ownership History
Date
Name
Owned For
Owner Type
Purchase Details
Closed on
Feb 10, 2014
Sold by
Fortson William H
Bought by
Coon Charles R and Coon Elaine A
Current Estimated Value
Home Financials for this Owner
Home Financials are based on the most recent Mortgage that was taken out on this home.
Original Mortgage
$196,000
Outstanding Balance
$150,223
Interest Rate
4.87%
Mortgage Type
Adjustable Rate Mortgage/ARM
Estimated Equity
$361,314
Purchase Details
Closed on
Aug 10, 1998
Sold by
Moniz Walter and Moniz Grace
Bought by
Fortson William H and Fortson Barbara J
Home Financials for this Owner
Home Financials are based on the most recent Mortgage that was taken out on this home.
Original Mortgage
$65,600
Interest Rate
6.95%
Mortgage Type
Stand Alone First
Create a Home Valuation Report for This Property
The Home Valuation Report is an in-depth analysis detailing your home's value as well as a comparison with similar homes in the area
Home Values in the Area
Average Home Value in this Area
Purchase History
| Date | Buyer | Sale Price | Title Company |
|---|---|---|---|
| Coon Charles R | $245,000 | Old Republic Title Company | |
| Fortson William H | $82,000 | Frontier Title Company |
Source: Public Records
Mortgage History
| Date | Status | Borrower | Loan Amount |
|---|---|---|---|
| Open | Coon Charles R | $196,000 | |
| Previous Owner | Fortson William H | $65,600 |
Source: Public Records
Tax History
| Year | Tax Paid | Tax Assessment Tax Assessment Total Assessment is a certain percentage of the fair market value that is determined by local assessors to be the total taxable value of land and additions on the property. | Land | Improvement |
|---|---|---|---|---|
| 2025 | $4,384 | $300,327 | $91,933 | $208,394 |
| 2024 | $4,384 | $294,439 | $90,131 | $204,308 |
| 2023 | $4,126 | $288,666 | $88,364 | $200,302 |
| 2022 | $4,030 | $283,007 | $86,633 | $196,374 |
| 2021 | $3,940 | $277,459 | $84,935 | $192,524 |
| 2020 | $3,955 | $274,615 | $84,065 | $190,550 |
| 2019 | $3,833 | $269,231 | $82,417 | $186,814 |
| 2018 | $3,586 | $263,952 | $80,801 | $183,151 |
| 2017 | $3,424 | $258,777 | $79,217 | $179,560 |
| 2016 | $2,853 | $253,704 | $77,664 | $176,040 |
| 2015 | $2,831 | $249,894 | $76,498 | $173,396 |
| 2014 | $1,169 | $104,869 | $38,365 | $66,504 |
Source: Public Records
Map
Nearby Homes
- 12 Daniels Ave
- 30 Benson Ave
- 136 Calhoun St Unit 73
- 470 Wilson Ave
- 237 Starboard Dr
- 178 Baxter St
- 732 Wilson Ave
- 61 Parrott St
- 25 Burnham St
- 110 Harrier Ave
- 144 Hilborn St
- 1 Harrier Ave
- 112 Harrier Ave
- 403 Lighthouse Dr
- 451 Lighthouse Dr
- 405 Lighthouse Dr
- 401 Lighthouse Dr
- 493 Lighthouse Dr
- 26 Baldwin St
- 535 Lighthouse Dr
Your Personal Tour Guide
Ask me questions while you tour the home.