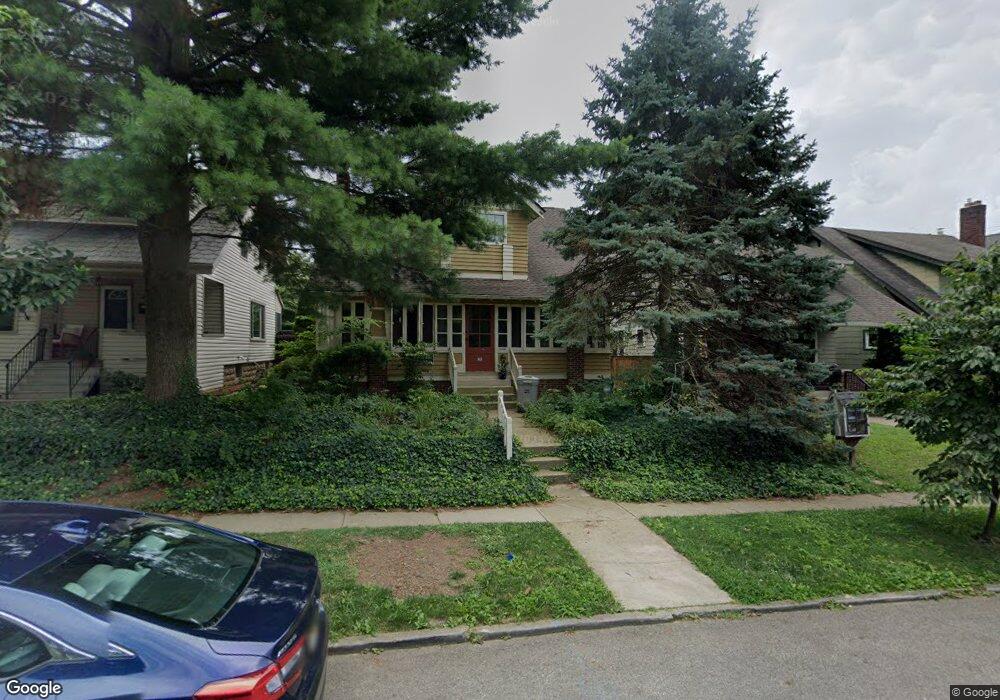
39 E Tulane Rd Columbus, OH 43202
Clintonville NeighborhoodEstimated Value: $402,386 - $525,000
3
Beds
2
Baths
1,528
Sq Ft
$293/Sq Ft
Est. Value
About This Home
This home is located at 39 E Tulane Rd, Columbus, OH 43202 and is currently estimated at $448,097, approximately $293 per square foot. 39 E Tulane Rd is a home located in Franklin County with nearby schools including Clinton Elementary School, Dominion Middle School, and Whetstone High School.
Ownership History
Date
Name
Owned For
Owner Type
Purchase Details
Closed on
Oct 2, 2006
Sold by
Semons Tad A
Bought by
Fish Kevin A and Casto Shelly M
Current Estimated Value
Home Financials for this Owner
Home Financials are based on the most recent Mortgage that was taken out on this home.
Original Mortgage
$201,832
Outstanding Balance
$118,195
Interest Rate
6.5%
Mortgage Type
FHA
Estimated Equity
$329,902
Purchase Details
Closed on
Aug 10, 2004
Sold by
Bean Clay
Bought by
Semons Tad A
Home Financials for this Owner
Home Financials are based on the most recent Mortgage that was taken out on this home.
Original Mortgage
$175,750
Interest Rate
6.08%
Mortgage Type
New Conventional
Purchase Details
Closed on
Sep 14, 1999
Sold by
Wyngaard Susan
Bought by
Bean Clay
Home Financials for this Owner
Home Financials are based on the most recent Mortgage that was taken out on this home.
Original Mortgage
$95,000
Interest Rate
7.93%
Mortgage Type
Balloon
Purchase Details
Closed on
Oct 4, 1990
Bought by
Wyngaard Susan
Purchase Details
Closed on
Jun 22, 1988
Create a Home Valuation Report for This Property
The Home Valuation Report is an in-depth analysis detailing your home's value as well as a comparison with similar homes in the area
Home Values in the Area
Average Home Value in this Area
Purchase History
| Date | Buyer | Sale Price | Title Company |
|---|---|---|---|
| Fish Kevin A | $205,000 | Worthington | |
| Semons Tad A | $185,000 | Title First | |
| Bean Clay | $131,000 | Title First Agency Inc | |
| Wyngaard Susan | -- | -- | |
| -- | $74,000 | -- |
Source: Public Records
Mortgage History
| Date | Status | Borrower | Loan Amount |
|---|---|---|---|
| Open | Fish Kevin A | $201,832 | |
| Closed | Semons Tad A | $175,750 | |
| Previous Owner | Bean Clay | $95,000 |
Source: Public Records
Tax History
| Year | Tax Paid | Tax Assessment Tax Assessment Total Assessment is a certain percentage of the fair market value that is determined by local assessors to be the total taxable value of land and additions on the property. | Land | Improvement |
|---|---|---|---|---|
| 2025 | $5,364 | $119,530 | $34,060 | $85,470 |
| 2024 | $5,364 | $119,530 | $34,060 | $85,470 |
| 2023 | $5,296 | $119,525 | $34,055 | $85,470 |
| 2022 | $5,388 | $103,890 | $25,170 | $78,720 |
| 2021 | $5,398 | $103,890 | $25,170 | $78,720 |
| 2020 | $5,405 | $103,890 | $25,170 | $78,720 |
| 2019 | $4,786 | $78,900 | $19,360 | $59,540 |
| 2018 | $4,398 | $78,900 | $19,360 | $59,540 |
| 2017 | $4,783 | $78,900 | $19,360 | $59,540 |
| 2016 | $4,428 | $66,850 | $18,690 | $48,160 |
| 2015 | $4,020 | $66,850 | $18,690 | $48,160 |
| 2014 | $4,030 | $66,850 | $18,690 | $48,160 |
| 2013 | $1,962 | $65,975 | $17,815 | $48,160 |
Source: Public Records
Map
Nearby Homes
- 10 E Weber Rd Unit 402
- 29 Crestview Rd
- 3021 N High St
- 45 E California Ave
- 99 E Pacemont Rd
- 94 W Tulane Rd
- 110 W Tulane Rd
- 53 Olentangy St
- 44 W Pacemont Rd
- 3027 Sunset Dr Unit 3027
- 3052 Dorris Ave Unit 3052
- 296 Walhalla Rd
- 74 E Dodridge St
- 109 E Arcadia Ave
- 2683 Neil Ave Unit 685
- 2717 Hibbert Ave
- 231 W Pacemont Rd Unit 235
- 270 Clinton Heights Ave
- 415 E Weber Rd
- 2771 Indianola Ave
- 35 E Tulane Rd
- 43 E Tulane Rd
- 29 E Tulane Rd
- 49 E Tulane Rd
- 53 E Tulane Rd
- 25 E Tulane Rd
- 30 Crestview Rd
- 26 Crestview Rd
- 36 Crestview Rd
- 22 Crestview Rd
- 59 E Tulane Rd
- 44 Crestview Rd
- 40 W Tulane Rd
- 48 E Tulane Rd
- 34 E Tulane Rd Unit 36
- 54 E Tulane Rd
- 28 E Tulane Rd
- 63 W Tulane Rd
- 52 Crestview Rd
- 63 E Tulane Rd
Your Personal Tour Guide
Ask me questions while you tour the home.