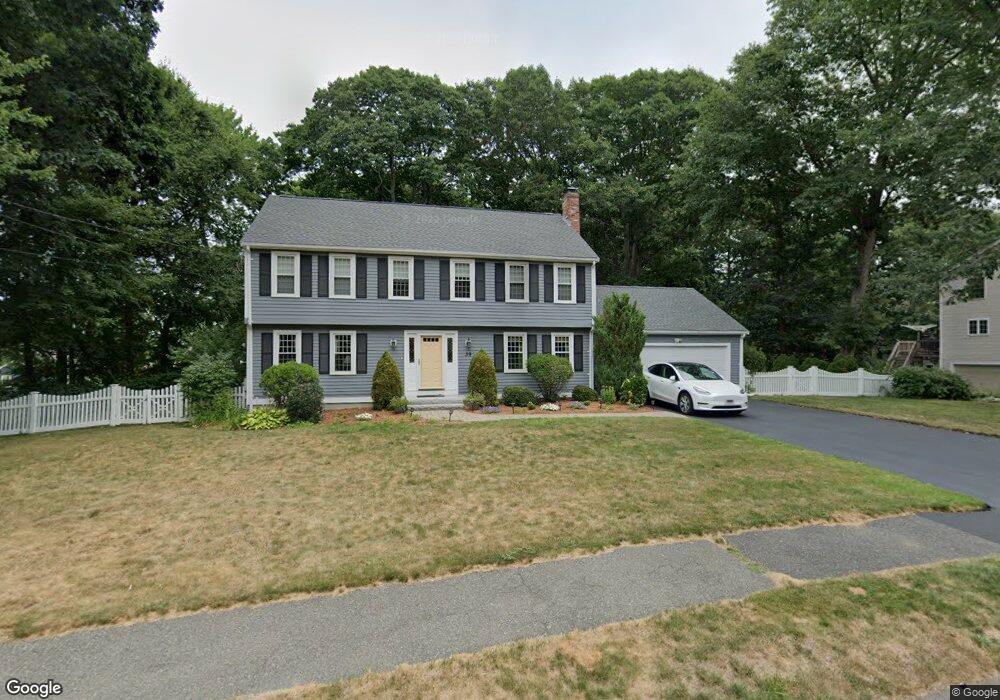
39 Mark Dr Milford, MA 01757
Estimated Value: $671,875 - $784,000
4
Beds
3
Baths
2,736
Sq Ft
$263/Sq Ft
Est. Value
About This Home
This home is located at 39 Mark Dr, Milford, MA 01757 and is currently estimated at $718,719, approximately $262 per square foot. 39 Mark Dr is a home located in Worcester County with nearby schools including Milford High School.
Ownership History
Date
Name
Owned For
Owner Type
Purchase Details
Closed on
Oct 11, 2007
Sold by
Gallagher Ellen M and Gallagher James P
Bought by
Edling Andrea E and Hocking Robert J
Current Estimated Value
Home Financials for this Owner
Home Financials are based on the most recent Mortgage that was taken out on this home.
Original Mortgage
$356,200
Outstanding Balance
$225,624
Interest Rate
6.49%
Mortgage Type
Purchase Money Mortgage
Estimated Equity
$493,095
Purchase Details
Closed on
Sep 1, 1999
Sold by
Mazar Gregory G and Mazar Joanne
Bought by
Gallagher James P and Gallagher Ellen M
Home Financials for this Owner
Home Financials are based on the most recent Mortgage that was taken out on this home.
Original Mortgage
$205,600
Interest Rate
7.5%
Mortgage Type
Purchase Money Mortgage
Purchase Details
Closed on
Jan 23, 1989
Sold by
Nashua Trust Co
Bought by
Mazar Gregory G
Create a Home Valuation Report for This Property
The Home Valuation Report is an in-depth analysis detailing your home's value as well as a comparison with similar homes in the area
Home Values in the Area
Average Home Value in this Area
Purchase History
| Date | Buyer | Sale Price | Title Company |
|---|---|---|---|
| Edling Andrea E | $375,000 | -- | |
| Gallagher James P | $257,000 | -- | |
| Mazar Gregory G | $195,000 | -- |
Source: Public Records
Mortgage History
| Date | Status | Borrower | Loan Amount |
|---|---|---|---|
| Open | Edling Andrea E | $356,200 | |
| Previous Owner | Mazar Gregory G | $215,000 | |
| Previous Owner | Mazar Gregory G | $204,745 | |
| Previous Owner | Mazar Gregory G | $205,600 |
Source: Public Records
Tax History Compared to Growth
Tax History
| Year | Tax Paid | Tax Assessment Tax Assessment Total Assessment is a certain percentage of the fair market value that is determined by local assessors to be the total taxable value of land and additions on the property. | Land | Improvement |
|---|---|---|---|---|
| 2025 | $7,457 | $582,600 | $185,600 | $397,000 |
| 2024 | $7,372 | $554,700 | $178,100 | $376,600 |
| 2023 | $6,985 | $483,400 | $154,000 | $329,400 |
| 2022 | $6,561 | $426,300 | $141,000 | $285,300 |
| 2021 | $6,259 | $391,700 | $141,000 | $250,700 |
| 2020 | $6,181 | $387,300 | $141,000 | $246,300 |
| 2019 | $6,014 | $363,600 | $141,000 | $222,600 |
| 2018 | $5,960 | $359,900 | $137,300 | $222,600 |
| 2017 | $5,808 | $345,900 | $137,300 | $208,600 |
| 2016 | $5,699 | $331,700 | $137,300 | $194,400 |
| 2015 | $5,570 | $317,400 | $129,900 | $187,500 |
Source: Public Records
Map
Nearby Homes
- 250 Congress St
- 9 Robin Rd
- 13 Hemlock Ln
- 44 Silver Hill Rd
- 54 Village Cir Unit 54
- 44 Woodridge Rd
- 56 Village Cir
- 20 Senate Rd
- 8 Colonial Rd
- 8 Vassar Dr
- 1 Tyler St
- 5 Stanford Cir
- 4 Kennedy Ln Unit 49
- 21 Shadowbrook Ln Unit 13
- 10 Shadowbrook Ln Unit 24
- 4 Shadowbrook Ln Unit 31
- 8 Shadowbrook Ln Unit 39
- 94 Highland St
- 18 Shadowbrook Ln Unit 40
- 1 Godfrey Ln Unit 1