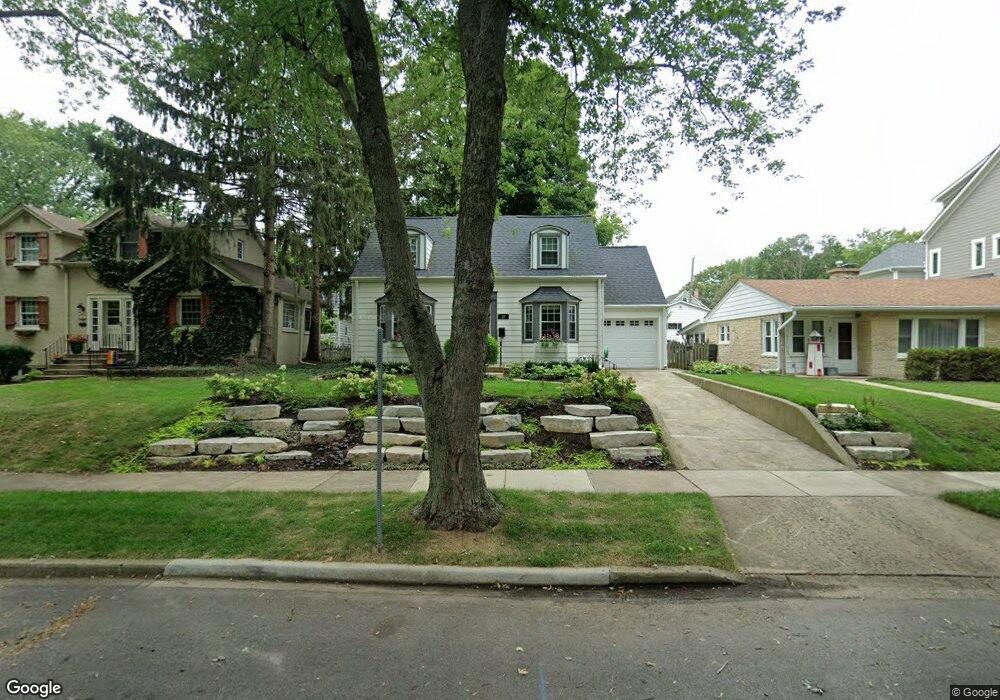
39 S Julian St Naperville, IL 60540
East Naperville NeighborhoodEstimated Value: $702,000 - $872,000
--
Bed
1
Bath
2,218
Sq Ft
$353/Sq Ft
Est. Value
About This Home
This home is located at 39 S Julian St, Naperville, IL 60540 and is currently estimated at $783,083, approximately $353 per square foot. 39 S Julian St is a home located in DuPage County with nearby schools including Admiral Byrd Elementary School, Washington Jr High School, and Naperville North High School.
Ownership History
Date
Name
Owned For
Owner Type
Purchase Details
Closed on
Dec 10, 2010
Sold by
Eifler James R
Bought by
Livin Eifler James R and James R Eifler Revocable Living Trust
Current Estimated Value
Purchase Details
Closed on
Feb 25, 2010
Sold by
Eifler Janet K
Bought by
Eifler James R
Home Financials for this Owner
Home Financials are based on the most recent Mortgage that was taken out on this home.
Original Mortgage
$244,800
Outstanding Balance
$162,491
Interest Rate
5.01%
Mortgage Type
New Conventional
Estimated Equity
$620,592
Purchase Details
Closed on
Jul 16, 1999
Sold by
Abe John W and Abe Stacey L
Bought by
Eifler James R and Eifler Janet K
Home Financials for this Owner
Home Financials are based on the most recent Mortgage that was taken out on this home.
Original Mortgage
$215,920
Interest Rate
7.68%
Create a Home Valuation Report for This Property
The Home Valuation Report is an in-depth analysis detailing your home's value as well as a comparison with similar homes in the area
Home Values in the Area
Average Home Value in this Area
Purchase History
| Date | Buyer | Sale Price | Title Company |
|---|---|---|---|
| Livin Eifler James R | -- | None Available | |
| Eifler James R | -- | None Available | |
| Eifler James R | $270,000 | First American Title Ins |
Source: Public Records
Mortgage History
| Date | Status | Borrower | Loan Amount |
|---|---|---|---|
| Open | Eifler James R | $244,800 | |
| Closed | Eifler James R | $215,920 |
Source: Public Records
Tax History Compared to Growth
Tax History
| Year | Tax Paid | Tax Assessment Tax Assessment Total Assessment is a certain percentage of the fair market value that is determined by local assessors to be the total taxable value of land and additions on the property. | Land | Improvement |
|---|---|---|---|---|
| 2024 | $11,249 | $199,626 | $110,436 | $89,190 |
| 2023 | $11,319 | $182,190 | $100,790 | $81,400 |
| 2022 | $10,841 | $173,510 | $95,990 | $77,520 |
| 2021 | $10,447 | $166,950 | $92,360 | $74,590 |
| 2020 | $10,226 | $163,950 | $90,700 | $73,250 |
| 2019 | $9,930 | $156,860 | $86,780 | $70,080 |
| 2018 | $9,585 | $151,580 | $83,860 | $67,720 |
| 2017 | $9,394 | $146,470 | $81,030 | $65,440 |
| 2016 | $9,207 | $141,170 | $78,100 | $63,070 |
| 2015 | $9,150 | $132,940 | $73,550 | $59,390 |
| 2014 | $9,449 | $132,940 | $73,550 | $59,390 |
| 2013 | $9,306 | $133,260 | $73,730 | $59,530 |
Source: Public Records
Map
Nearby Homes
- 203 S Columbia St
- 116 S Wright St
- 915 E Chicago Ave
- 5 N Columbia St
- 105 S Wright St
- 130 N Huffman St
- 328 S Loomis St
- 440 S Columbia St
- 488 S Columbia St
- 316 N Loomis St
- 820 Prairie Ave
- 636 E 4th Ave
- 1068 Mattande Ln
- 328 E 4th Ave
- 326 E 4th Ave
- 1133 Catherine Ave
- 110 S Washington St Unit 400
- 904 Coletta Cir
- 520 S Washington St Unit 103
- 520 S Washington St Unit 201
- 45 S Julian St
- 35 S Julian St
- 725 E Chicago Ave
- 725 E Chicago Ave Unit A
- 725 E Chicago Ave Unit B
- 29 S Julian St
- 36 S Julian St
- 23 S Julian St
- 446 S Julian St
- 44 S Julian St
- 56 S Julian St
- 56 S Julian St Unit 1
- 106 S Columbia St
- 30 S Julian St
- 19 S Julian St
- 32 S Columbia St
- 114 S Columbia St
- 24 S Julian St
- 24 S Columbia St
- 124 S Columbia St