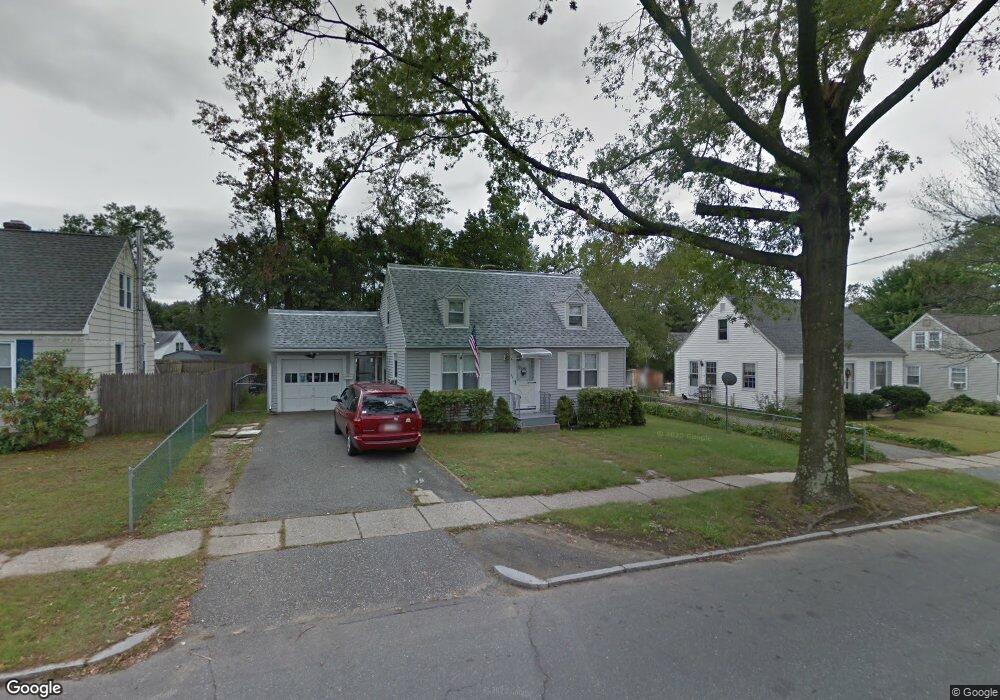
39 Surrey Rd Springfield, MA 01118
East Forest Park NeighborhoodEstimated Value: $286,000 - $316,000
4
Beds
1
Bath
1,116
Sq Ft
$268/Sq Ft
Est. Value
About This Home
This home is located at 39 Surrey Rd, Springfield, MA 01118 and is currently estimated at $299,301, approximately $268 per square foot. 39 Surrey Rd is a home located in Hampden County with nearby schools including Mary A. Dryden Veterans Memorial School, M Marcus Kiley Middle, and Springfield High School of Science and Technology.
Ownership History
Date
Name
Owned For
Owner Type
Purchase Details
Closed on
Feb 1, 2005
Sold by
Dalinsky Arline C
Bought by
Huntley Dan N and Huntley Mary T
Current Estimated Value
Home Financials for this Owner
Home Financials are based on the most recent Mortgage that was taken out on this home.
Original Mortgage
$124,000
Outstanding Balance
$62,695
Interest Rate
5.67%
Mortgage Type
Purchase Money Mortgage
Estimated Equity
$236,606
Create a Home Valuation Report for This Property
The Home Valuation Report is an in-depth analysis detailing your home's value as well as a comparison with similar homes in the area
Home Values in the Area
Average Home Value in this Area
Purchase History
| Date | Buyer | Sale Price | Title Company |
|---|---|---|---|
| Huntley Dan N | $134,000 | -- |
Source: Public Records
Mortgage History
| Date | Status | Borrower | Loan Amount |
|---|---|---|---|
| Open | Huntley Dan N | $124,000 |
Source: Public Records
Tax History
| Year | Tax Paid | Tax Assessment Tax Assessment Total Assessment is a certain percentage of the fair market value that is determined by local assessors to be the total taxable value of land and additions on the property. | Land | Improvement |
|---|---|---|---|---|
| 2025 | $3,851 | $245,600 | $46,800 | $198,800 |
| 2024 | $3,630 | $226,000 | $46,800 | $179,200 |
| 2023 | $3,782 | $221,800 | $44,600 | $177,200 |
| 2022 | $3,237 | $172,000 | $44,600 | $127,400 |
| 2021 | $2,875 | $152,100 | $40,500 | $111,600 |
| 2020 | $2,892 | $148,100 | $40,500 | $107,600 |
| 2019 | $2,716 | $138,000 | $40,500 | $97,500 |
| 2018 | $2,444 | $124,200 | $40,500 | $83,700 |
| 2017 | $2,385 | $121,300 | $40,500 | $80,800 |
| 2016 | $2,165 | $110,100 | $40,500 | $69,600 |
| 2015 | $2,004 | $101,900 | $40,500 | $61,400 |
Source: Public Records
Map
Nearby Homes
Your Personal Tour Guide
Ask me questions while you tour the home.