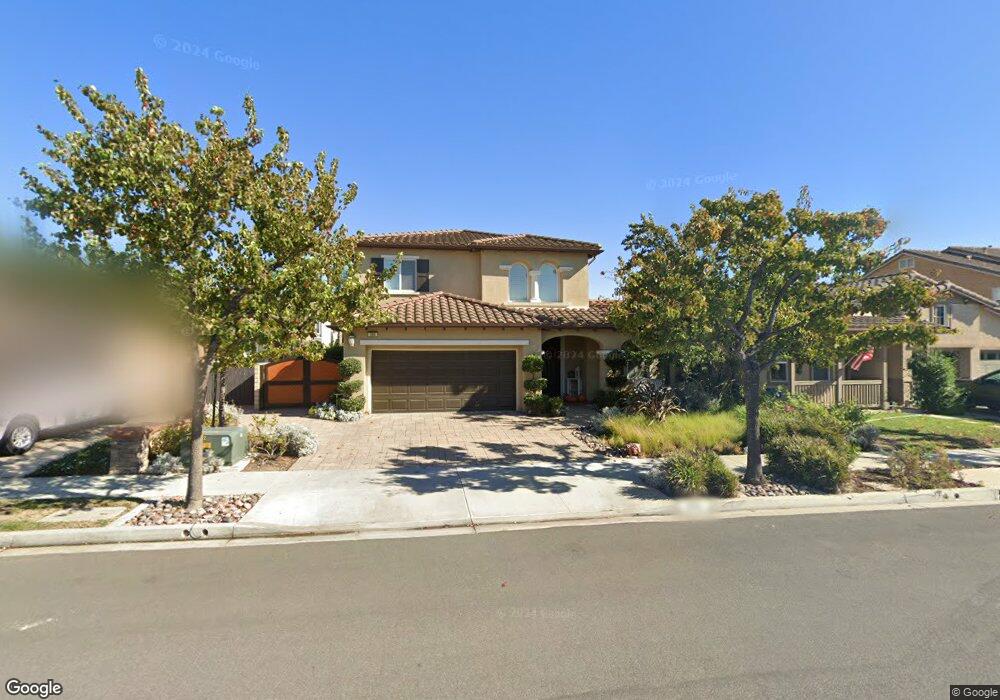
390 Castleton St Camarillo, CA 93012
Estimated Value: $1,181,000 - $1,336,000
4
Beds
3
Baths
2,760
Sq Ft
$456/Sq Ft
Est. Value
About This Home
This home is located at 390 Castleton St, Camarillo, CA 93012 and is currently estimated at $1,257,833, approximately $455 per square foot. 390 Castleton St is a home located in Ventura County with nearby schools including Rancho Rosal Elementary School, Monte Vista Middle School, and Adolfo Camarillo High School.
Ownership History
Date
Name
Owned For
Owner Type
Purchase Details
Closed on
May 19, 2009
Sold by
Jp Morgan Chase Bank Na
Bought by
Jacobs John and Jacobs Janet L
Current Estimated Value
Home Financials for this Owner
Home Financials are based on the most recent Mortgage that was taken out on this home.
Original Mortgage
$342,000
Outstanding Balance
$214,802
Interest Rate
4.82%
Mortgage Type
Purchase Money Mortgage
Estimated Equity
$1,043,031
Purchase Details
Closed on
Jul 1, 2005
Sold by
Western Pacific Housing Inc
Bought by
Belinfante Perry
Home Financials for this Owner
Home Financials are based on the most recent Mortgage that was taken out on this home.
Original Mortgage
$555,432
Interest Rate
1%
Mortgage Type
Negative Amortization
Create a Home Valuation Report for This Property
The Home Valuation Report is an in-depth analysis detailing your home's value as well as a comparison with similar homes in the area
Home Values in the Area
Average Home Value in this Area
Purchase History
| Date | Buyer | Sale Price | Title Company |
|---|---|---|---|
| Jacobs John | $616,000 | Fidelity National Title | |
| Belinfante Perry | $694,500 | -- |
Source: Public Records
Mortgage History
| Date | Status | Borrower | Loan Amount |
|---|---|---|---|
| Open | Jacobs John | $342,000 | |
| Previous Owner | Belinfante Perry | $555,432 |
Source: Public Records
Tax History
| Year | Tax Paid | Tax Assessment Tax Assessment Total Assessment is a certain percentage of the fair market value that is determined by local assessors to be the total taxable value of land and additions on the property. | Land | Improvement |
|---|---|---|---|---|
| 2025 | $8,866 | $793,244 | $396,623 | $396,621 |
| 2024 | $8,691 | $777,691 | $388,846 | $388,845 |
| 2023 | $8,379 | $762,443 | $381,222 | $381,221 |
| 2022 | $8,355 | $747,494 | $373,747 | $373,747 |
| 2021 | $8,055 | $732,838 | $366,419 | $366,419 |
| 2020 | $8,026 | $725,326 | $362,663 | $362,663 |
| 2019 | $7,991 | $711,104 | $355,552 | $355,552 |
| 2018 | $7,844 | $697,162 | $348,581 | $348,581 |
| 2017 | $7,381 | $683,494 | $341,747 | $341,747 |
| 2016 | $7,204 | $670,094 | $335,047 | $335,047 |
| 2015 | $7,129 | $660,030 | $330,015 | $330,015 |
| 2014 | $6,919 | $643,000 | $321,000 | $322,000 |
Source: Public Records
Map
Nearby Homes
- 406 Town Forest Ct
- 291 Riverdale Ct Unit 106
- 259 Riverdale Ct Unit 241
- 259 Riverdale Ct Unit 263
- 409 Spring Park Rd
- 243 Riverdale Ct Unit 431
- 3615 Dusk Dr
- 2860 Via Monte Mar
- 2862 Via Descanso
- 533 Via Vallarta
- 537 Via Vallarta
- 539 Via Vallarta
- 541 Via Vallarta
- 551 Via Vallarta
- 553 Via Vallarta
- 555 Via Vallarta
- 559 Via Vallarta
- 3812 Golden Pond Dr
- 62 + Calleguas
- 2764 Petit St
- 384 Castleton St
- 408 Castleton St
- 410 Castleton St
- 372 Castleton St
- 383 Twilight Ct
- 391 Twilight Ct
- 375 Twilight Ct
- 401 Twilight Ct
- 361 Twilight Ct
- 3093 White Rock Rd
- 418 Castleton St
- 366 Castleton St
- 419 Twilight Ct
- 351 Twilight Ct
- 359 Castleton St
- 3091 White Rock Rd
- 420 Castleton St
- 431 Twilight Ct
- 3088 White Rock Rd
- 347 Twilight Ct
Your Personal Tour Guide
Ask me questions while you tour the home.