Estimated Value: $582,000 - $767,000
5
Beds
3
Baths
2,492
Sq Ft
$259/Sq Ft
Est. Value
About This Home
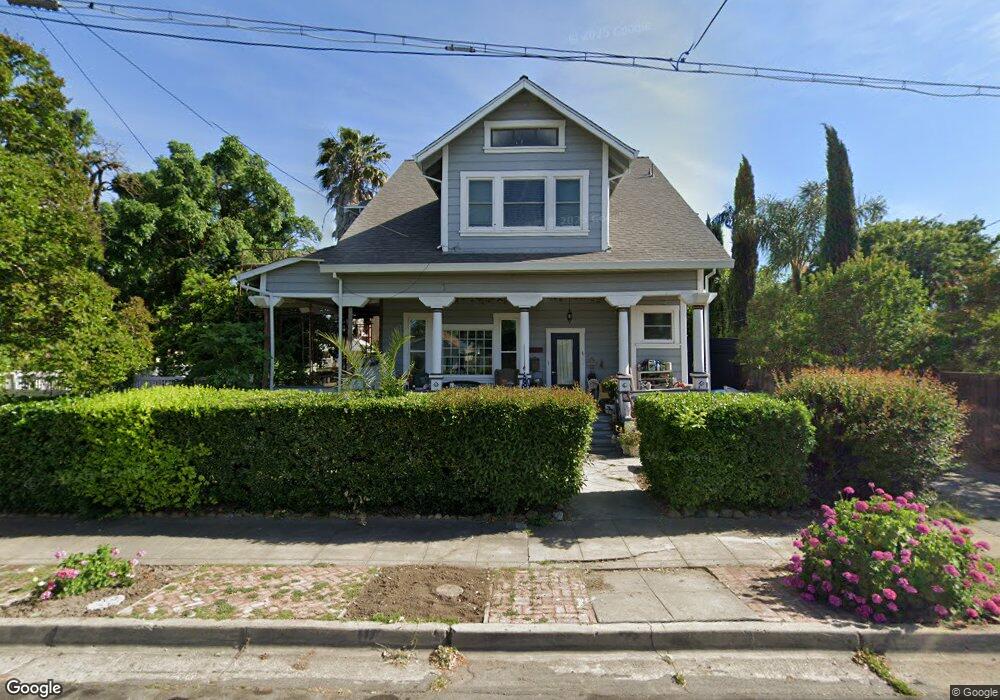
This home is located at 390 E B St, Dixon, CA 95620 and is currently estimated at $645,611, approximately $259 per square foot. 390 E B St is a home located in Solano County with nearby schools including Anderson (Linford L.) Elementary School, Dixon High School, and Dixon Montessori Charter.
Ownership History
Date
Name
Owned For
Owner Type
Purchase Details
Closed on
Sep 11, 2015
Sold by
Echarte Antoinette P
Bought by
Echarte Antoinette P and The A P Echarte 2015 Family Tr
Current Estimated Value
Purchase Details
Closed on
Feb 9, 2006
Sold by
Almarez Robert R and Almarez Bonnie J
Bought by
Echarte Antoinette P
Home Financials for this Owner
Home Financials are based on the most recent Mortgage that was taken out on this home.
Original Mortgage
$113,000
Interest Rate
6.2%
Mortgage Type
Stand Alone Second
Purchase Details
Closed on
Sep 12, 2000
Sold by
Mccarthy Timothy H and Georgana H Mccarthy 1990 Trust
Bought by
Almarez Robert R and Almarez Bonnie J
Home Financials for this Owner
Home Financials are based on the most recent Mortgage that was taken out on this home.
Original Mortgage
$185,250
Interest Rate
8.11%
Create a Home Valuation Report for This Property
The Home Valuation Report is an in-depth analysis detailing your home's value as well as a comparison with similar homes in the area
Home Values in the Area
Average Home Value in this Area
Purchase History
| Date | Buyer | Sale Price | Title Company |
|---|---|---|---|
| Echarte Antoinette P | -- | None Available | |
| Echarte Antoinette P | $565,000 | First American Title Co | |
| Almarez Robert R | $195,000 | Fidelity National Title Co |
Source: Public Records
Mortgage History
| Date | Status | Borrower | Loan Amount |
|---|---|---|---|
| Closed | Echarte Antoinette P | $113,000 | |
| Previous Owner | Almarez Robert R | $185,250 |
Source: Public Records
Tax History
| Year | Tax Paid | Tax Assessment Tax Assessment Total Assessment is a certain percentage of the fair market value that is determined by local assessors to be the total taxable value of land and additions on the property. | Land | Improvement |
|---|---|---|---|---|
| 2025 | $10,970 | $601,000 | $72,000 | $529,000 |
| 2024 | $10,970 | $601,000 | $72,000 | $529,000 |
| 2023 | $6,642 | $601,000 | $72,000 | $529,000 |
| 2022 | $6,677 | $601,000 | $72,000 | $529,000 |
| 2021 | $6,434 | $575,000 | $69,000 | $506,000 |
| 2020 | $5,743 | $517,000 | $67,000 | $450,000 |
| 2019 | $5,197 | $468,000 | $65,000 | $403,000 |
| 2018 | $5,007 | $444,000 | $66,000 | $378,000 |
| 2017 | $4,979 | $444,000 | $66,000 | $378,000 |
| 2016 | $4,071 | $373,000 | $59,000 | $314,000 |
| 2015 | $3,983 | $368,000 | $59,000 | $309,000 |
| 2014 | $3,853 | $353,000 | $60,000 | $293,000 |
Source: Public Records
Map
Nearby Homes
Your Personal Tour Guide
Ask me questions while you tour the home.