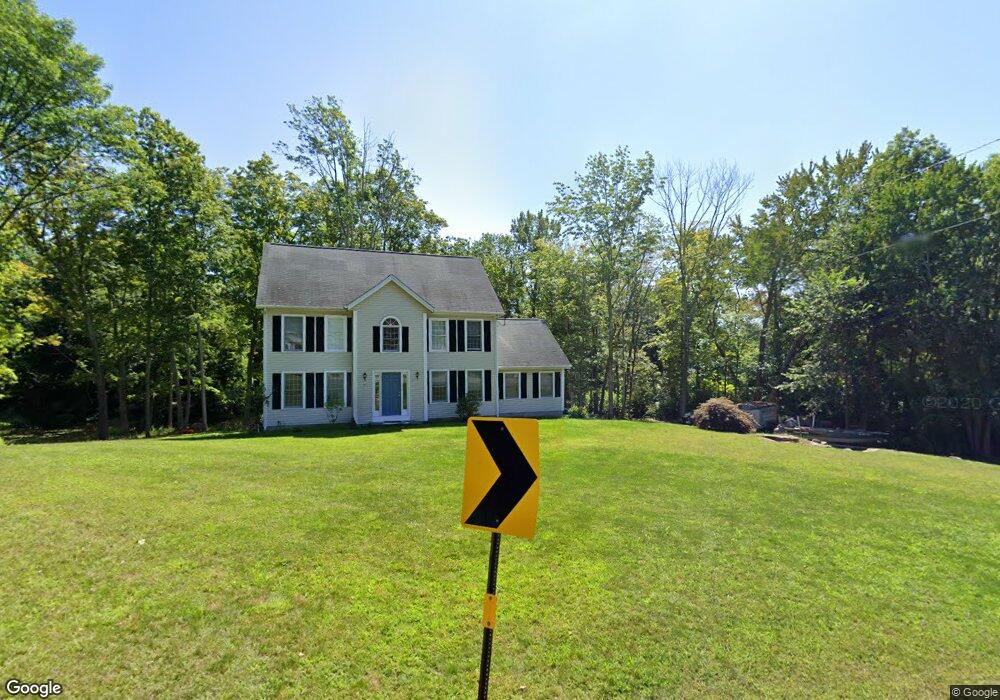
390 N Main St Salem, NH 03079
Arlington Pond NeighborhoodEstimated Value: $679,262 - $835,000
3
Beds
3
Baths
2,116
Sq Ft
$365/Sq Ft
Est. Value
About This Home
This home is located at 390 N Main St, Salem, NH 03079 and is currently estimated at $771,316, approximately $364 per square foot. 390 N Main St is a home located in Rockingham County with nearby schools including North Salem Elementary School, Woodbury School, and Salem High School.
Ownership History
Date
Name
Owned For
Owner Type
Purchase Details
Closed on
Jul 15, 2021
Sold by
Simms Paul S and Simms Cindy S
Bought by
Simms Ft
Current Estimated Value
Purchase Details
Closed on
Dec 18, 1997
Sold by
Carey Shaun J and Carey Pamela J
Bought by
Simms Paul S and Simms Cindy S
Home Financials for this Owner
Home Financials are based on the most recent Mortgage that was taken out on this home.
Original Mortgage
$151,200
Interest Rate
7.14%
Create a Home Valuation Report for This Property
The Home Valuation Report is an in-depth analysis detailing your home's value as well as a comparison with similar homes in the area
Home Values in the Area
Average Home Value in this Area
Purchase History
| Date | Buyer | Sale Price | Title Company |
|---|---|---|---|
| Simms Ft | -- | None Available | |
| Simms Paul S | $189,000 | -- |
Source: Public Records
Mortgage History
| Date | Status | Borrower | Loan Amount |
|---|---|---|---|
| Previous Owner | Simms Paul S | $151,200 |
Source: Public Records
Tax History Compared to Growth
Tax History
| Year | Tax Paid | Tax Assessment Tax Assessment Total Assessment is a certain percentage of the fair market value that is determined by local assessors to be the total taxable value of land and additions on the property. | Land | Improvement |
|---|---|---|---|---|
| 2024 | $8,254 | $469,000 | $163,800 | $305,200 |
| 2023 | $7,954 | $469,000 | $163,800 | $305,200 |
| 2022 | $7,527 | $469,000 | $163,800 | $305,200 |
| 2021 | $7,495 | $469,000 | $163,800 | $305,200 |
| 2020 | $7,390 | $335,600 | $117,200 | $218,400 |
| 2019 | $7,376 | $335,600 | $117,200 | $218,400 |
| 2018 | $7,064 | $335,600 | $117,200 | $218,400 |
| 2017 | $6,856 | $335,600 | $117,200 | $218,400 |
| 2016 | $6,856 | $335,600 | $117,200 | $218,400 |
| 2015 | $6,299 | $294,500 | $115,900 | $178,600 |
| 2014 | $6,123 | $294,500 | $115,900 | $178,600 |
| 2013 | $6,025 | $294,500 | $115,900 | $178,600 |
Source: Public Records
Map
Nearby Homes
- 390 N Main St Unit Suite C
- 381 N Main St
- 377 N Main St
- 383 N Main St
- 396 N Main St
- 114 E Broadway
- 398 N Main St
- 382 N Main St Unit 2
- 6 Mill Pond Rd
- 119 E Broadway
- 112 E Broadway
- 112 E Broadway Unit 3
- 112 E Broadway Unit 4
- 112 E Broadway Unit 1
- 112 E Broadway Unit 2
- 115 E Broadway
- 387 N Main St
- 14 Driftwood Cir Unit 3
- 10 Driftwood Cir Unit 1
- 12 Driftwood Cir Unit 2