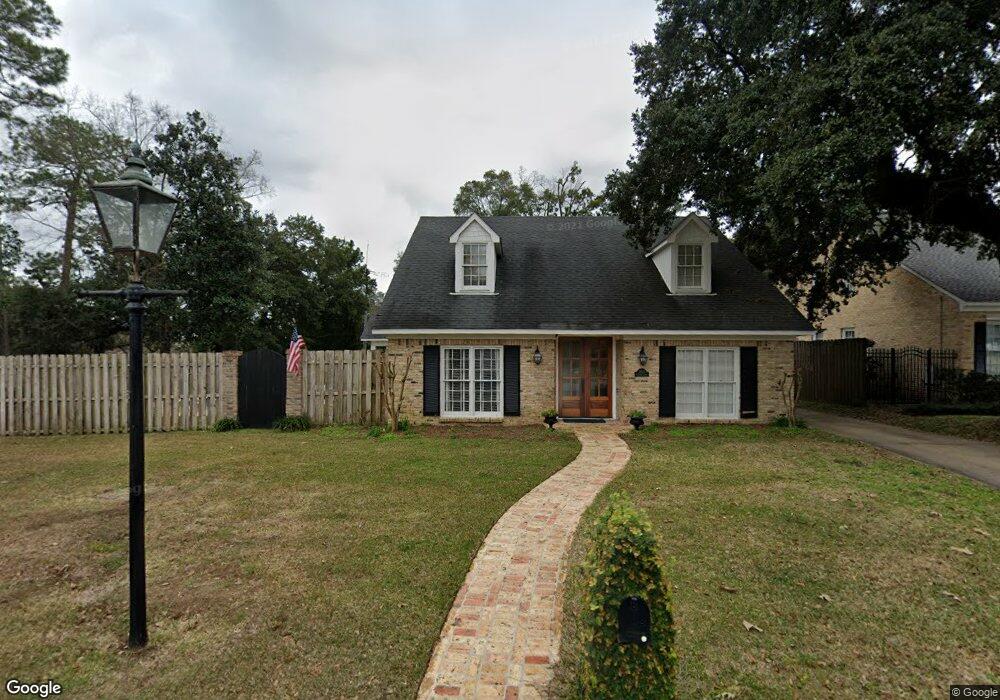
3903 Mcgregor Ct Mobile, AL 36608
Parkhill NeighborhoodEstimated Value: $639,000 - $808,000
Studio
2
Baths
3,722
Sq Ft
$201/Sq Ft
Est. Value
About This Home
This home is located at 3903 Mcgregor Ct, Mobile, AL 36608 and is currently estimated at $747,830, approximately $200 per square foot. 3903 Mcgregor Ct is a home located in Mobile County with nearby schools including Mary B. Austin Elementary School, CL Scarborough Middle School, and Murphy High School.
Ownership History
Date
Name
Owned For
Owner Type
Purchase Details
Closed on
Dec 21, 2009
Sold by
Mosley Michael B and Mosley Sharon B
Bought by
Mosley Michael B
Current Estimated Value
Home Financials for this Owner
Home Financials are based on the most recent Mortgage that was taken out on this home.
Original Mortgage
$175,000
Outstanding Balance
$112,869
Interest Rate
4.92%
Mortgage Type
Credit Line Revolving
Estimated Equity
$634,961
Purchase Details
Closed on
Feb 21, 2004
Sold by
Mosley Michael B and Mosley Sharon B
Bought by
Mosley Michael B
Home Financials for this Owner
Home Financials are based on the most recent Mortgage that was taken out on this home.
Original Mortgage
$308,700
Outstanding Balance
$136,923
Interest Rate
5.38%
Mortgage Type
New Conventional
Estimated Equity
$610,907
Purchase Details
Closed on
Dec 26, 2000
Sold by
Stone John E and Stone Philomene M
Bought by
Mosley Michael B and Mosley Sharon B
Home Financials for this Owner
Home Financials are based on the most recent Mortgage that was taken out on this home.
Original Mortgage
$234,650
Interest Rate
7.72%
Create a Home Valuation Report for This Property
The Home Valuation Report is an in-depth analysis detailing your home's value as well as a comparison with similar homes in the area
Home Values in the Area
Average Home Value in this Area
Purchase History
| Date | Buyer | Sale Price | Title Company |
|---|---|---|---|
| Mosley Michael B | -- | None Available | |
| Mosley Michael B | -- | -- | |
| Mosley Michael B | -- | -- |
Source: Public Records
Mortgage History
| Date | Status | Borrower | Loan Amount |
|---|---|---|---|
| Open | Mosley Michael B | $175,000 | |
| Open | Mosley Michael B | $308,700 | |
| Closed | Mosley Michael B | $234,650 | |
| Closed | Mosley Michael B | $308,700 |
Source: Public Records
Tax History
| Year | Tax Paid | Tax Assessment Tax Assessment Total Assessment is a certain percentage of the fair market value that is determined by local assessors to be the total taxable value of land and additions on the property. | Land | Improvement |
|---|---|---|---|---|
| 2025 | $3,547 | $56,760 | $16,000 | $40,760 |
| 2024 | $3,547 | $57,270 | $16,000 | $41,270 |
| 2023 | $3,580 | $50,520 | $16,000 | $34,520 |
| 2022 | $3,043 | $48,970 | $16,000 | $32,970 |
| 2021 | $2,737 | $44,150 | $16,000 | $28,150 |
| 2020 | $2,680 | $43,250 | $15,000 | $28,250 |
| 2019 | $2,671 | $43,120 | $0 | $0 |
| 2018 | $2,693 | $43,460 | $0 | $0 |
| 2017 | $2,363 | $38,260 | $0 | $0 |
| 2016 | $2,284 | $37,020 | $0 | $0 |
| 2013 | $2,412 | $38,680 | $0 | $0 |
Source: Public Records
Map
Nearby Homes
- 3930 Yester Place
- 40 Buerger Rd
- 4559 Old Shell Rd Unit 4559
- 3805 Austill Ln
- 157 N Mcgregor Ave Unit B
- 7230 Old Shell Rd
- 3816 Austill Ln
- 10 Hathaway Rd S
- 13 Princess Anne Rd
- 122 Mcgregor Ave S
- 4009 Old Shell Rd Unit E12
- 4009 Old Shell Rd Unit C 14
- 4009 Old Shell Rd Unit C19
- 4009 Old Shell Rd Unit C13
- 4120 Ursuline Dr
- 1 Croydon Rd
- 3806 Claridge Rd N
- 53 Warwick Rd
- 0 Canterbury Park Unit 7381790
- 0 Canterbury Park Unit 7381783
- 3905 Mcgregor Ct
- 3909 Mcgregor Ct
- 3909 Mcgregor Ct
- 3913 Mcgregor Ct
- 3904 Mcgregor Ct
- 3900 Mcgregor Ct
- 3910 Mcgregor Ct
- 58 Mcgregor Ave S
- 3901 Mcgregor Ave S
- 3917 Mcgregor Ct
- 3920 Mcgregor Ct
- 54 Mcgregor Ave S
- 3925 Mcgregor Ct
- 3924 Mcgregor Ct
- 12 Mcgregor Ave S
- 12 Mcgregor Ave S Unit B
- 3929 Mcgregor Ct
- 3908 Spring Bank Rd
- 3928 Mcgregor Ct
- 3906 Spring Bank Rd
Your Personal Tour Guide
Ask me questions while you tour the home.