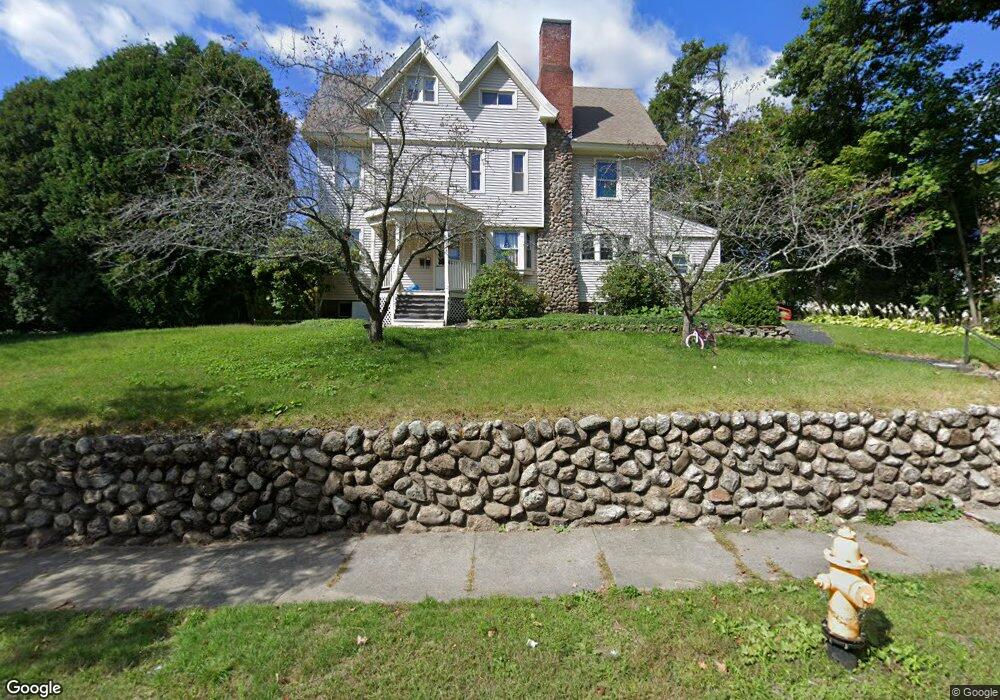
391 May St Worcester, MA 01602
Tatnuck NeighborhoodEstimated Value: $711,000 - $846,000
7
Beds
4
Baths
4,402
Sq Ft
$177/Sq Ft
Est. Value
About This Home
This home is located at 391 May St, Worcester, MA 01602 and is currently estimated at $780,284, approximately $177 per square foot. 391 May St is a home located in Worcester County with nearby schools including Chandler Magnet, Tatnuck Magnet School, and Jacob Hiatt Magnet School.
Ownership History
Date
Name
Owned For
Owner Type
Purchase Details
Closed on
Sep 30, 2005
Sold by
Gablaski Mary A and Gablaski Richard E
Bought by
Valentin Josefina
Current Estimated Value
Home Financials for this Owner
Home Financials are based on the most recent Mortgage that was taken out on this home.
Original Mortgage
$369,000
Outstanding Balance
$198,500
Interest Rate
5.84%
Mortgage Type
Purchase Money Mortgage
Estimated Equity
$581,784
Create a Home Valuation Report for This Property
The Home Valuation Report is an in-depth analysis detailing your home's value as well as a comparison with similar homes in the area
Home Values in the Area
Average Home Value in this Area
Purchase History
| Date | Buyer | Sale Price | Title Company |
|---|---|---|---|
| Valentin Josefina | $435,000 | -- |
Source: Public Records
Mortgage History
| Date | Status | Borrower | Loan Amount |
|---|---|---|---|
| Open | Valentin Josefina | $369,000 |
Source: Public Records
Tax History
| Year | Tax Paid | Tax Assessment Tax Assessment Total Assessment is a certain percentage of the fair market value that is determined by local assessors to be the total taxable value of land and additions on the property. | Land | Improvement |
|---|---|---|---|---|
| 2025 | $9,614 | $728,900 | $119,700 | $609,200 |
| 2024 | $9,160 | $666,200 | $119,700 | $546,500 |
| 2023 | $8,601 | $599,800 | $104,100 | $495,700 |
| 2022 | $8,399 | $552,200 | $83,300 | $468,900 |
| 2021 | $7,601 | $466,900 | $66,700 | $400,200 |
| 2020 | $7,082 | $416,600 | $66,600 | $350,000 |
| 2019 | $7,369 | $409,400 | $60,300 | $349,100 |
| 2018 | $7,180 | $379,700 | $60,300 | $319,400 |
| 2017 | $6,771 | $352,300 | $60,300 | $292,000 |
| 2016 | $6,836 | $331,700 | $45,800 | $285,900 |
| 2015 | $6,657 | $331,700 | $45,800 | $285,900 |
| 2014 | $6,481 | $331,700 | $45,800 | $285,900 |
Source: Public Records
Map
Nearby Homes
- 73 Moore Ave
- 860 Pleasant St
- 10 Wrentham Rd Unit 308
- 31 Lenox St
- 16 Sherwood Rd
- 15 Chesterfield Rd
- 26 Westbrook Rd
- 118 Beaconsfield Rd
- 2 Saxon Rd
- 122 Copperfield Rd
- 18 Hadwen Ln
- 47R Yarnie Unit 1B
- 47R Yarnie Unit 4A
- 47R Yarnie Unit 1A
- 35 Hadwen Ln
- 10 Perrot St
- 23 Tiverton Pkwy
- 24 Hadwen Rd
- 23 Orrison St
- 53 Tiverton Pkwy
Your Personal Tour Guide
Ask me questions while you tour the home.