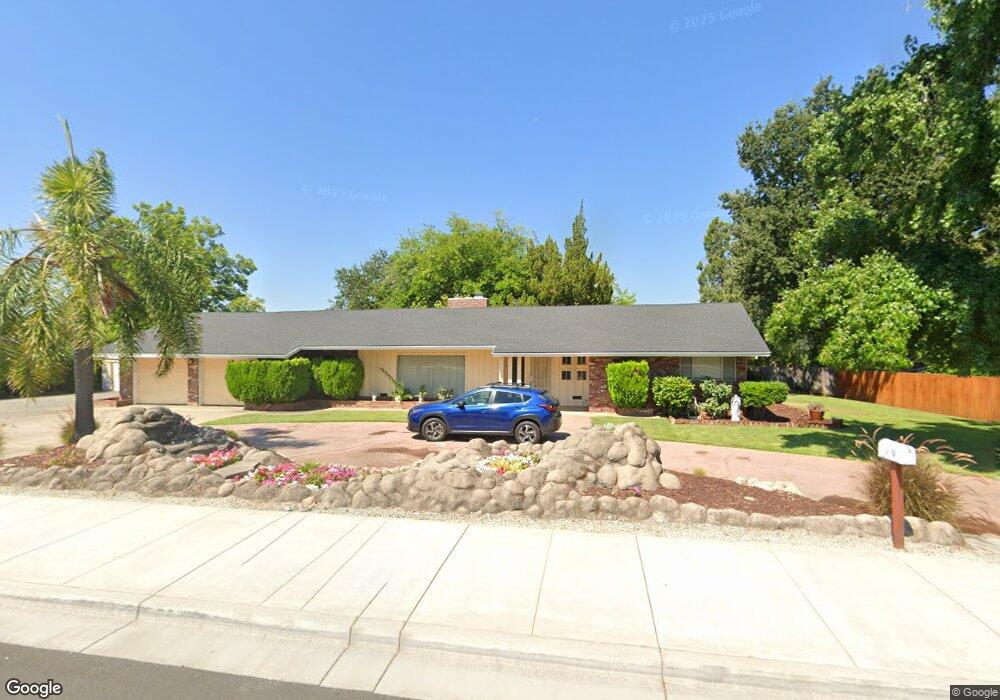
3910 Bechelli Ln Unit 1 Redding, CA 96002
South Bechelli NeighborhoodEstimated Value: $296,000 - $452,000
4
Beds
3
Baths
2,400
Sq Ft
$164/Sq Ft
Est. Value
About This Home
This home is located at 3910 Bechelli Ln Unit 1, Redding, CA 96002 and is currently estimated at $393,748, approximately $164 per square foot. 3910 Bechelli Ln Unit 1 is a home located in Shasta County with nearby schools including Lassen View Elementary School, Parsons Junior High School, and Enterprise High School.
Ownership History
Date
Name
Owned For
Owner Type
Purchase Details
Closed on
Mar 6, 2025
Sold by
Adams Family Living Trust and Adams Jimmy
Bought by
3910 Bechelli Statutory Trust and Shasta Property Llc
Current Estimated Value
Purchase Details
Closed on
Jan 29, 2018
Sold by
Adams Jimmy and Adams Tammy
Bought by
Adams Jimmy and Adams Tammy
Home Financials for this Owner
Home Financials are based on the most recent Mortgage that was taken out on this home.
Original Mortgage
$127,000
Interest Rate
3.94%
Mortgage Type
New Conventional
Purchase Details
Closed on
Dec 4, 2015
Sold by
Adams Jimmy and Adams Tammy
Bought by
The Adams Family Living Trust and Adams Tammy
Purchase Details
Closed on
Aug 17, 1999
Sold by
Kelly Robert S & Edna V Tr Kelly Trust
Bought by
Vento Jimmy C and Vento Tammy T
Home Financials for this Owner
Home Financials are based on the most recent Mortgage that was taken out on this home.
Original Mortgage
$120,000
Interest Rate
7.56%
Mortgage Type
Seller Take Back
Create a Home Valuation Report for This Property
The Home Valuation Report is an in-depth analysis detailing your home's value as well as a comparison with similar homes in the area
Home Values in the Area
Average Home Value in this Area
Purchase History
| Date | Buyer | Sale Price | Title Company |
|---|---|---|---|
| 3910 Bechelli Statutory Trust | -- | None Listed On Document | |
| Adams Jimmy | -- | Placer Title Co | |
| Adams Jimmy | -- | Placer Title Co | |
| The Adams Family Living Trust | -- | None Available | |
| Vento Jimmy C | $145,000 | Placer Title Company |
Source: Public Records
Mortgage History
| Date | Status | Borrower | Loan Amount |
|---|---|---|---|
| Previous Owner | Adams Jimmy | $127,000 | |
| Previous Owner | Vento Jimmy C | $120,000 | |
| Closed | Vento Jimmy C | $5,000 |
Source: Public Records
Tax History
| Year | Tax Paid | Tax Assessment Tax Assessment Total Assessment is a certain percentage of the fair market value that is determined by local assessors to be the total taxable value of land and additions on the property. | Land | Improvement |
|---|---|---|---|---|
| 2025 | $2,431 | $222,838 | $38,413 | $184,425 |
| 2024 | $2,397 | $218,469 | $37,660 | $180,809 |
| 2023 | $2,397 | $214,186 | $36,922 | $177,264 |
| 2022 | $2,330 | $209,988 | $36,199 | $173,789 |
| 2021 | $2,250 | $205,872 | $35,490 | $170,382 |
| 2020 | $2,241 | $203,762 | $35,127 | $168,635 |
| 2019 | $2,223 | $199,768 | $34,439 | $165,329 |
| 2018 | $2,197 | $195,852 | $33,764 | $162,088 |
| 2017 | $2,236 | $192,012 | $33,102 | $158,910 |
| 2016 | $2,092 | $188,248 | $32,453 | $155,795 |
| 2015 | $2,075 | $185,421 | $31,966 | $153,455 |
| 2014 | $2,060 | $181,790 | $31,340 | $150,450 |
Source: Public Records
Map
Nearby Homes
- 3708 Traverse St
- 688 Julie Way
- 4218 Jane St
- 1106 2nd St
- 723 Woodacre Dr
- 1209 C St
- 3527 Adams Ln
- 1108 4th St
- 3428 Adams Ln
- 952 Camino Ct
- 4323 Churn Crk Rd
- 2940 Felstet Ln
- 5367 Rosswood Ln
- 0 Lot4 Unit 2 Ph 2 Stillwater Unit 25-4962
- 0 Lot3 Unit 2 Ph 2 Stillwater Unit 25-4961
- 0 Lot6 Unit 2 Ph 2 Stillwater Unit 25-4964
- 0 Lot5 Unit 2 Ph 2 Stillwater Unit 25-4963
- 0 Lot16 Unit 2 Ph 2 Stillwater Unit 25-4958
- 0 Lot9 Unit 2 Ph 2 Stillwater Unit 25-4967
- 0 Lot2 Unit 2 Ph 2 Stillwater Unit 25-4960
- 3910 Bechelli Ln
- 3903 Cheryl Dr
- 3874 Bechelli Ln
- 3932 Bechelli Ln
- 3873 Cheryl Dr Unit 1
- 3873 Cheryl Dr
- 3931 Cheryl Dr
- 3708 Cheryl Dr
- 3829 Loustalot Way
- 3807 Loustalot Way
- 3844 Bechelli Ln
- 3843 Cheryl Dive
- 3843 Cheryl Dr
- 3845 Loustalot Way
- 506 Joaquin Ave
- 486 Loma Vista Dr Unit 1
- 486 Loma Vista Dr
- 3965 Cheryl Dr
- 3867 Loustalot Way
- 3900 Cheryl Dr
Your Personal Tour Guide
Ask me questions while you tour the home.