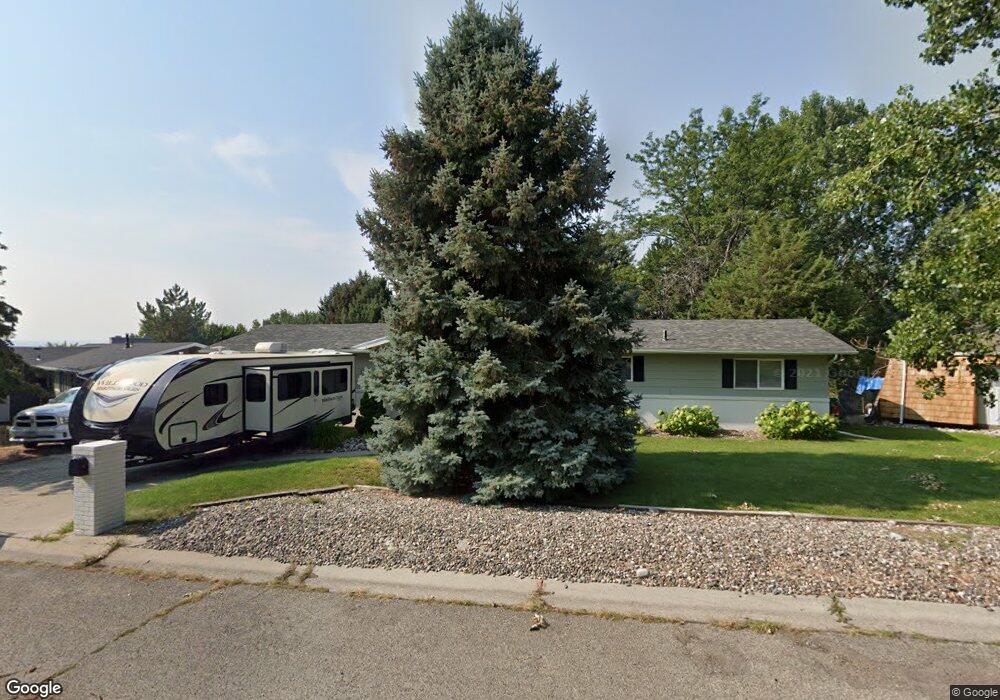
3914 Pine Cove Rd Billings, MT 59102
West Shiloh NeighborhoodEstimated Value: $439,000 - $512,000
4
Beds
3
Baths
2,760
Sq Ft
$172/Sq Ft
Est. Value
About This Home
This home is located at 3914 Pine Cove Rd, Billings, MT 59102 and is currently estimated at $473,456, approximately $171 per square foot. 3914 Pine Cove Rd is a home located in Yellowstone County with nearby schools including Arrowhead School, Ben Steele Middle School, and Billings West High School.
Ownership History
Date
Name
Owned For
Owner Type
Purchase Details
Closed on
Dec 30, 2013
Sold by
Secretary Of Hud
Bought by
Baumgardner Kevin J
Current Estimated Value
Home Financials for this Owner
Home Financials are based on the most recent Mortgage that was taken out on this home.
Original Mortgage
$148,000
Outstanding Balance
$110,781
Interest Rate
4.17%
Mortgage Type
New Conventional
Estimated Equity
$362,675
Purchase Details
Closed on
Jul 23, 2013
Sold by
Parks Barron and Parks Linda R
Bought by
Citimortgage Inc
Purchase Details
Closed on
Aug 11, 2006
Sold by
Hanson Larry D and Davidson Kay J
Bought by
Parks Barron and Parks Linda R
Home Financials for this Owner
Home Financials are based on the most recent Mortgage that was taken out on this home.
Original Mortgage
$203,162
Interest Rate
6.76%
Mortgage Type
FHA
Purchase Details
Closed on
Sep 15, 2005
Sold by
Davidson Kay
Bought by
Hanson Larry D
Create a Home Valuation Report for This Property
The Home Valuation Report is an in-depth analysis detailing your home's value as well as a comparison with similar homes in the area
Home Values in the Area
Average Home Value in this Area
Purchase History
| Date | Buyer | Sale Price | Title Company |
|---|---|---|---|
| Baumgardner Kevin J | -- | None Available | |
| Citimortgage Inc | $270,752 | Title Financial Specialty Se | |
| Parks Barron | -- | Stewart Title Of Billings | |
| Hanson Larry D | -- | None Available |
Source: Public Records
Mortgage History
| Date | Status | Borrower | Loan Amount |
|---|---|---|---|
| Open | Baumgardner Kevin J | $148,000 | |
| Previous Owner | Parks Barron | $203,162 |
Source: Public Records
Tax History Compared to Growth
Tax History
| Year | Tax Paid | Tax Assessment Tax Assessment Total Assessment is a certain percentage of the fair market value that is determined by local assessors to be the total taxable value of land and additions on the property. | Land | Improvement |
|---|---|---|---|---|
| 2025 | $3,842 | $429,500 | $94,404 | $335,096 |
| 2024 | $3,842 | $402,200 | $88,344 | $313,856 |
| 2023 | $3,838 | $402,200 | $88,344 | $313,856 |
| 2022 | $2,753 | $291,600 | $0 | $0 |
| 2021 | $3,037 | $291,600 | $0 | $0 |
| 2020 | $3,025 | $278,400 | $0 | $0 |
| 2019 | $2,886 | $278,400 | $0 | $0 |
| 2018 | $2,869 | $272,000 | $0 | $0 |
| 2017 | $2,786 | $272,000 | $0 | $0 |
| 2016 | $2,441 | $239,500 | $0 | $0 |
| 2015 | $2,386 | $239,500 | $0 | $0 |
| 2014 | $2,288 | $122,271 | $0 | $0 |
Source: Public Records
Map
Nearby Homes
- 3023 Melrose Ln
- 3928 Audubon Way
- 3953 Rimrock Rd
- 3316 Laredo Place
- 3957 Palisades Park Dr
- 4022 Laredo Place
- 3945 Laredo Place
- 3323 Reimers Park Dr
- 4044 Backwoods Dr
- 3743 Hayden Dr
- 3617 Marjorie Dr
- 2631 Country Ln
- 4265 Laredo Place
- 5045 Audubon Way
- 5073 Audubon Way
- 3441 Poly Dr Unit 15
- 2786 Zimmerman Trail
- 2213 Westfield Dr
- 4416 Pine Cove Rd
- 2745 Zimmerman Trail
- 3918 Pine Cove Rd
- 3915 Audubon Way
- 3907 Audubon Way
- 3919 Audubon Way
- 3922 Pine Cove Rd
- 3915 Pine Cove Rd
- 3911 Pine Cove Rd
- 3919 Pine Cove Rd
- 3019 Melrose Ln
- 3907 Pine Cove Rd
- 3903 Pine Cove Rd
- 3928 Pine Cove Rd
- 3923 Pine Cove Rd
- 3910 Audubon Way
- 3816 Pine Cove Rd
- 3845 Audubon Way
- 3902 Palisades Park Dr
- 3916 Audubon Way
- 3015 Melrose Ln
- 3908 Palisades Park Dr