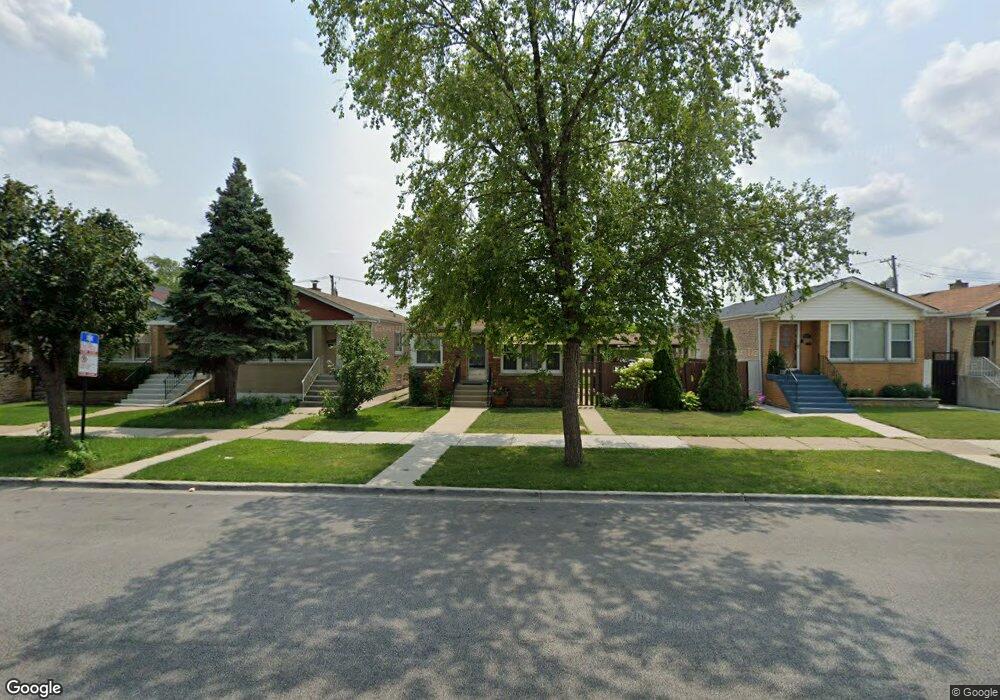
3915 W 55th St Chicago, IL 60632
West Elsdon NeighborhoodEstimated Value: $247,897 - $326,000
3
Beds
1
Bath
1,009
Sq Ft
$294/Sq Ft
Est. Value
About This Home
This home is located at 3915 W 55th St, Chicago, IL 60632 and is currently estimated at $296,474, approximately $293 per square foot. 3915 W 55th St is a home located in Cook County with nearby schools including Peck Elementary School, Richardson Middle School, and Curie Metropolitan High School.
Ownership History
Date
Name
Owned For
Owner Type
Purchase Details
Closed on
Jun 9, 2016
Sold by
Garcia Bernardo and Garcia Maria
Bought by
Abarca Fausto and Abarca Victoria
Current Estimated Value
Purchase Details
Closed on
May 14, 2009
Sold by
Garcia Bernardo and Garcia Maria
Bought by
Garcia Bernardo and Garcia Maria
Home Financials for this Owner
Home Financials are based on the most recent Mortgage that was taken out on this home.
Original Mortgage
$131,000
Interest Rate
4.85%
Mortgage Type
New Conventional
Purchase Details
Closed on
Nov 10, 2007
Sold by
Garcia Bernardo
Bought by
Garcia Bernardo and Silva Maria Del Pilar
Purchase Details
Closed on
Jun 29, 2002
Sold by
Garcia Gilberto and Garcia Margarita
Bought by
Garcia Bernardo
Home Financials for this Owner
Home Financials are based on the most recent Mortgage that was taken out on this home.
Original Mortgage
$129,000
Interest Rate
6.8%
Create a Home Valuation Report for This Property
The Home Valuation Report is an in-depth analysis detailing your home's value as well as a comparison with similar homes in the area
Home Values in the Area
Average Home Value in this Area
Purchase History
| Date | Buyer | Sale Price | Title Company |
|---|---|---|---|
| Abarca Fausto | $117,000 | Greater Illinois Title | |
| Garcia Bernardo | -- | None Available | |
| Garcia Bernardo | -- | None Available | |
| Garcia Bernardo | -- | World Title Guaranty Inc |
Source: Public Records
Mortgage History
| Date | Status | Borrower | Loan Amount |
|---|---|---|---|
| Previous Owner | Garcia Bernardo | $131,000 | |
| Previous Owner | Garcia Bernardo | $129,000 |
Source: Public Records
Tax History
| Year | Tax Paid | Tax Assessment Tax Assessment Total Assessment is a certain percentage of the fair market value that is determined by local assessors to be the total taxable value of land and additions on the property. | Land | Improvement |
|---|---|---|---|---|
| 2025 | $2,970 | $18,595 | $2,420 | $16,175 |
| 2024 | $2,970 | $18,595 | $2,420 | $16,175 |
| 2023 | $2,330 | $14,000 | $3,025 | $10,975 |
| 2022 | $2,330 | $14,000 | $3,025 | $10,975 |
| 2021 | $2,279 | $13,999 | $3,025 | $10,974 |
| 2020 | $1,824 | $10,619 | $3,025 | $7,594 |
| 2019 | $1,903 | $12,157 | $3,025 | $9,132 |
| 2018 | $1,871 | $12,157 | $3,025 | $9,132 |
| 2017 | $1,968 | $11,781 | $2,722 | $9,059 |
| 2016 | $1,972 | $11,781 | $2,722 | $9,059 |
| 2015 | $1,787 | $11,781 | $2,722 | $9,059 |
| 2014 | $1,723 | $11,269 | $2,571 | $8,698 |
| 2013 | $1,680 | $11,269 | $2,571 | $8,698 |
Source: Public Records
Map
Nearby Homes
- 3912 W 55th Place
- 3836 W 55th St
- 3800 W 55th St
- 4025 W 56th St
- 3701 W 55th Place
- 5238 S Springfield Ave
- 3741 W 57th Place
- 5251 S Hamlin Ave
- 5229 S Avers Ave
- 3733 W 58th St
- 3704 W 58th St
- 3633 W 58th Place
- 5834 S Keeler Ave
- 3825 W 59th Place
- 3914 W 51st St
- 3860 W 51st St Unit 2
- 5921 S Keeler Ave
- 3444 W 53rd Place
- 3400 W 55th St Unit 1N
- 3642 W 51st St
- 3915 W 55th St
- 3913 W 55th St
- 3911 W 55th St
- 3921 W 55th St
- 3923 W 55th St
- 3909 W 55th St
- 3909 W 55th Place
- 3927 W 55th St
- 3905 W 55th St
- 3918 W 55th Place
- 3931 W 55th St
- 3931 W 55th Place
- 3901 W 55th St
- 3910 W 55th Place
- 3920 W 55th Place
- 3906 W 55th Place
- 3924 W 55th Place
- 3933 W 55th St
- 3904 W 55th Place
- 3928 W 55th Place
Your Personal Tour Guide
Ask me questions while you tour the home.