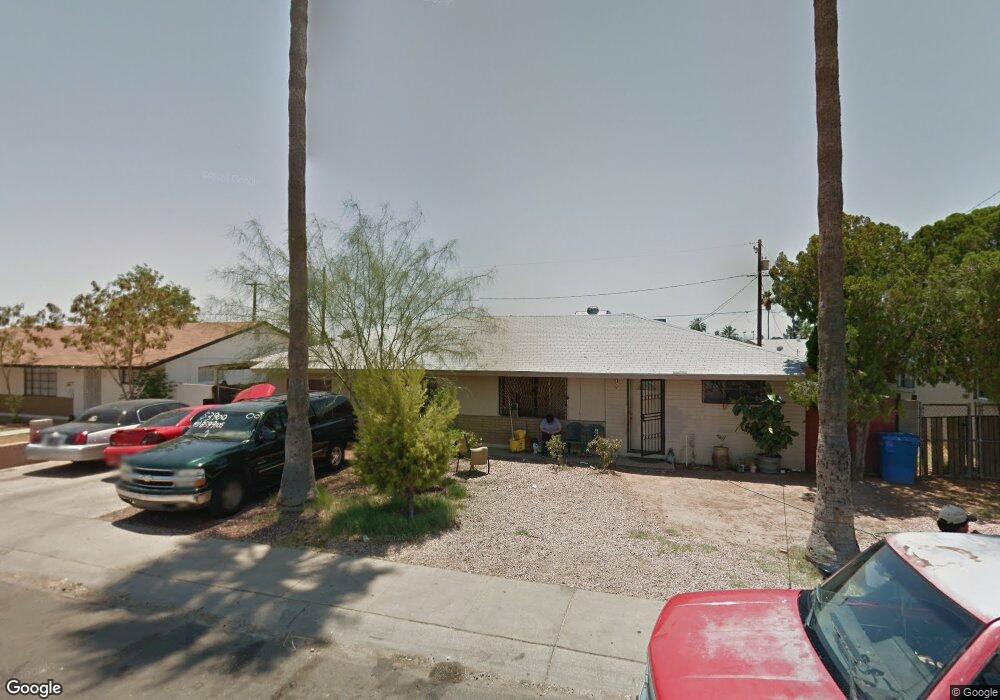
3915 W Thomas Rd Phoenix, AZ 85019
Maryvale NeighborhoodEstimated Value: $270,802 - $374,000
Studio
2
Baths
1,915
Sq Ft
$166/Sq Ft
Est. Value
About This Home
This home is located at 3915 W Thomas Rd, Phoenix, AZ 85019 and is currently estimated at $317,701, approximately $165 per square foot. 3915 W Thomas Rd is a home located in Maricopa County with nearby schools including P T Coe Elementary School, Isaac Middle School, and Carl Hayden High School.
Ownership History
Date
Name
Owned For
Owner Type
Purchase Details
Closed on
Dec 20, 2006
Sold by
Flores Elsa
Bought by
Flores Jose Luis
Current Estimated Value
Home Financials for this Owner
Home Financials are based on the most recent Mortgage that was taken out on this home.
Original Mortgage
$10,000
Outstanding Balance
$4,108
Interest Rate
6.16%
Mortgage Type
Unknown
Estimated Equity
$313,593
Purchase Details
Closed on
Dec 19, 2006
Sold by
Flores Jose Luis
Bought by
Flores Jose Luis and Romero Pedro T
Home Financials for this Owner
Home Financials are based on the most recent Mortgage that was taken out on this home.
Original Mortgage
$10,000
Outstanding Balance
$4,108
Interest Rate
6.16%
Mortgage Type
Unknown
Estimated Equity
$313,593
Purchase Details
Closed on
Aug 7, 1996
Sold by
Flores Elsa
Bought by
Flores Jose Luis
Purchase Details
Closed on
Jul 27, 1996
Sold by
Rollins Margaret J and Rollins Caroline
Bought by
Flores Jose Luis
Create a Home Valuation Report for This Property
The Home Valuation Report is an in-depth analysis detailing your home's value as well as a comparison with similar homes in the area
Home Values in the Area
Average Home Value in this Area
Purchase History
| Date | Buyer | Sale Price | Title Company |
|---|---|---|---|
| Flores Jose Luis | -- | Camelback Title Agency Llc | |
| Flores Jose Luis | -- | Camelback Title Agency Llc | |
| Flores Jose Luis | -- | Chicago Title Insurance Co | |
| Flores Jose Luis | $58,000 | Chicago Title Insurance Co |
Source: Public Records
Mortgage History
| Date | Status | Borrower | Loan Amount |
|---|---|---|---|
| Open | Flores Jose Luis | $10,000 | |
| Open | Flores Jose Luis | $115,500 |
Source: Public Records
Tax History
| Year | Tax Paid | Tax Assessment Tax Assessment Total Assessment is a certain percentage of the fair market value that is determined by local assessors to be the total taxable value of land and additions on the property. | Land | Improvement |
|---|---|---|---|---|
| 2025 | $1,846 | $12,572 | -- | -- |
| 2024 | $1,820 | $11,974 | -- | -- |
| 2023 | $1,820 | $22,300 | $4,460 | $17,840 |
| 2022 | $1,726 | $17,700 | $3,540 | $14,160 |
| 2021 | $1,657 | $15,780 | $3,150 | $12,630 |
| 2020 | $1,620 | $13,850 | $2,770 | $11,080 |
| 2019 | $1,584 | $13,030 | $2,600 | $10,430 |
| 2018 | $724 | $10,400 | $2,080 | $8,320 |
| 2017 | $635 | $8,150 | $1,630 | $6,520 |
| 2016 | $616 | $6,850 | $1,370 | $5,480 |
| 2015 | $560 | $5,510 | $1,100 | $4,410 |
Source: Public Records
Map
Nearby Homes
- 2714 N 40th Ave
- 3020 N 40th Ave
- 3025 N 37th Dr
- 3823 W Earll Dr
- 4107 W Virginia Ave
- 3801 W Wilshire Dr
- 2502 N 38th Ln
- 3801 W Lewis Ave
- 2301 N 39th Ln
- 2646 N 43rd Ave Unit B
- 2652 N 43rd Ave Unit C
- 4117 W Mulberry Dr
- 4338 W Thomas Rd
- 2674 N 43rd Ave Unit D
- 3830 W Crittenden Ln
- 3528 W Encanto Blvd
- 3952 W Hubbell St
- 4420 W Earll Dr
- 3914 W Palm Ln Unit 5
- 4342 W Encanto Blvd
- 3911 W Thomas Rd
- 3921 W Thomas Rd
- 2820 N 39th Dr
- 2818 N 39th Dr
- 3927 W Thomas Rd
- 2834 N 39th Ave
- 2828 N 39th Ave
- 2815 N 39th Dr
- 2822 N 39th Ave
- 2812 N 39th Dr Unit 2030
- 2812 N 39th Dr
- 3914 W Thomas Rd
- 2819 N 39th Ln
- 3920 W Thomas Rd
- 3908 W Thomas Rd
- 2813 N 39th Ln
- 2818 N 39th Ave
- 2811 N 39th Dr
- 2809 N 39th Ln
- 3902 W Thomas Rd
Your Personal Tour Guide
Ask me questions while you tour the home.