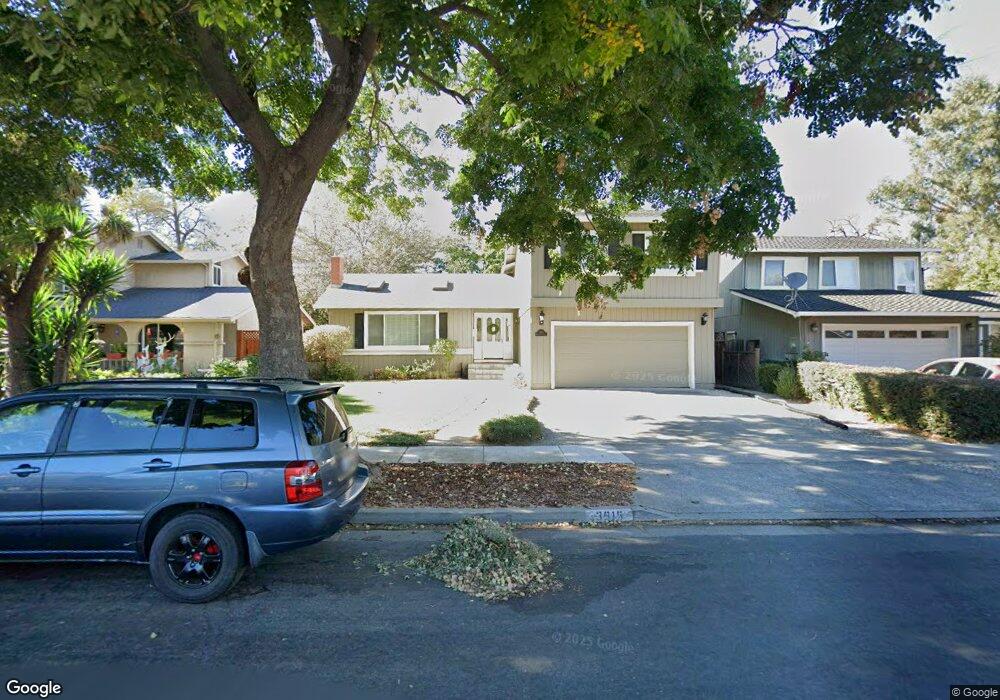
3915 Wellington Square San Jose, CA 95136
Blossom Valley NeighborhoodEstimated Value: $1,665,000 - $1,783,000
4
Beds
3
Baths
1,860
Sq Ft
$926/Sq Ft
Est. Value
About This Home
This home is located at 3915 Wellington Square, San Jose, CA 95136 and is currently estimated at $1,722,898, approximately $926 per square foot. 3915 Wellington Square is a home located in Santa Clara County with nearby schools including Terrell Elementary School, John Muir Middle School, and Gunderson High School.
Ownership History
Date
Name
Owned For
Owner Type
Purchase Details
Closed on
Jan 28, 2016
Sold by
Cornell Brett M and Call Bambi M
Bought by
Cornellcall 2016 Revocable Living Trust and Call Bambi Michelle
Current Estimated Value
Purchase Details
Closed on
Jan 3, 2012
Sold by
Wilson Kirk Robert and Wilson Ronda Anne
Bought by
Cornell Brett M and Call Bambi M
Home Financials for this Owner
Home Financials are based on the most recent Mortgage that was taken out on this home.
Original Mortgage
$488,750
Outstanding Balance
$334,752
Interest Rate
3.96%
Mortgage Type
New Conventional
Estimated Equity
$1,388,146
Purchase Details
Closed on
Jun 20, 2011
Sold by
Wilson Kirk R and Wilson Ronda A
Bought by
Wilson Kirk Robert and Wilson Anne
Purchase Details
Closed on
Jun 19, 2002
Sold by
Henderson Boyd A
Bought by
Wilson Kirk R and Wilson Ronda A
Home Financials for this Owner
Home Financials are based on the most recent Mortgage that was taken out on this home.
Original Mortgage
$385,000
Interest Rate
6.71%
Create a Home Valuation Report for This Property
The Home Valuation Report is an in-depth analysis detailing your home's value as well as a comparison with similar homes in the area
Home Values in the Area
Average Home Value in this Area
Purchase History
| Date | Buyer | Sale Price | Title Company |
|---|---|---|---|
| Cornellcall 2016 Revocable Living Trust | -- | None Available | |
| Cornell Brett M | $575,000 | Old Republic Title Company | |
| Wilson Kirk Robert | -- | None Available | |
| Wilson Kirk R | -- | None Available | |
| Wilson Kirk R | $585,000 | Old Republic Title Company |
Source: Public Records
Mortgage History
| Date | Status | Borrower | Loan Amount |
|---|---|---|---|
| Open | Cornell Brett M | $488,750 | |
| Previous Owner | Wilson Kirk R | $385,000 |
Source: Public Records
Tax History Compared to Growth
Tax History
| Year | Tax Paid | Tax Assessment Tax Assessment Total Assessment is a certain percentage of the fair market value that is determined by local assessors to be the total taxable value of land and additions on the property. | Land | Improvement |
|---|---|---|---|---|
| 2025 | $9,632 | $722,222 | $505,558 | $216,664 |
| 2024 | $9,632 | $708,062 | $495,646 | $212,416 |
| 2023 | $9,435 | $694,179 | $485,928 | $208,251 |
| 2022 | $9,353 | $680,568 | $476,400 | $204,168 |
| 2021 | $9,144 | $667,224 | $467,059 | $200,165 |
| 2020 | $8,923 | $660,383 | $462,270 | $198,113 |
| 2019 | $8,725 | $647,435 | $453,206 | $194,229 |
| 2018 | $8,631 | $634,741 | $444,320 | $190,421 |
| 2017 | $8,556 | $622,296 | $435,608 | $186,688 |
| 2016 | $8,381 | $610,095 | $427,067 | $183,028 |
| 2015 | $8,321 | $600,932 | $420,653 | $180,279 |
| 2014 | $7,872 | $589,161 | $412,413 | $176,748 |
Source: Public Records
Map
Nearby Homes
- 4315 Montmorency Ct
- 4464 Bald Eagle Way
- 3359 Jenkins Ave
- 4970 Cherry Ave Unit 110
- 4970 Cherry Ave Unit 211
- 883 Calle de Verde
- 3137 Jenkins Ave
- 4501 Waterville Dr
- 3104 Cherry Ave
- 4519 Waterville Dr
- 4570 Waterville Dr
- 1322 Shawn Dr Unit 3
- 4581 Shadowhurst Ct
- 1472 Fairhaven Ct
- 4783 Capay Dr Unit 1
- 4586 Cimarron River Ct
- 2820 Cardinal Ln
- 4568 Cimarron River Ct
- 3300 Narvaez Ave Unit 175
- 5098 Trenary Way
- 3925 Wellington Square
- 3905 Wellington Square
- 3935 Wellington Square
- 3895 Wellington Square
- 3914 Wellington Square
- 3904 Wellington Square
- 3945 Wellington Square
- 3885 Wellington Square
- 3924 Wellington Square
- 3894 Wellington Square
- 3934 Wellington Square
- 3884 Wellington Square
- 3875 Wellington Square
- 3955 Wellington Square
- 3944 Wellington Square
- 3874 Wellington Square
- 3941 Thousand Oaks Dr
- 3959 Thousand Oaks Dr
- 3925 Thousand Oaks Dr
- 3865 Wellington Square