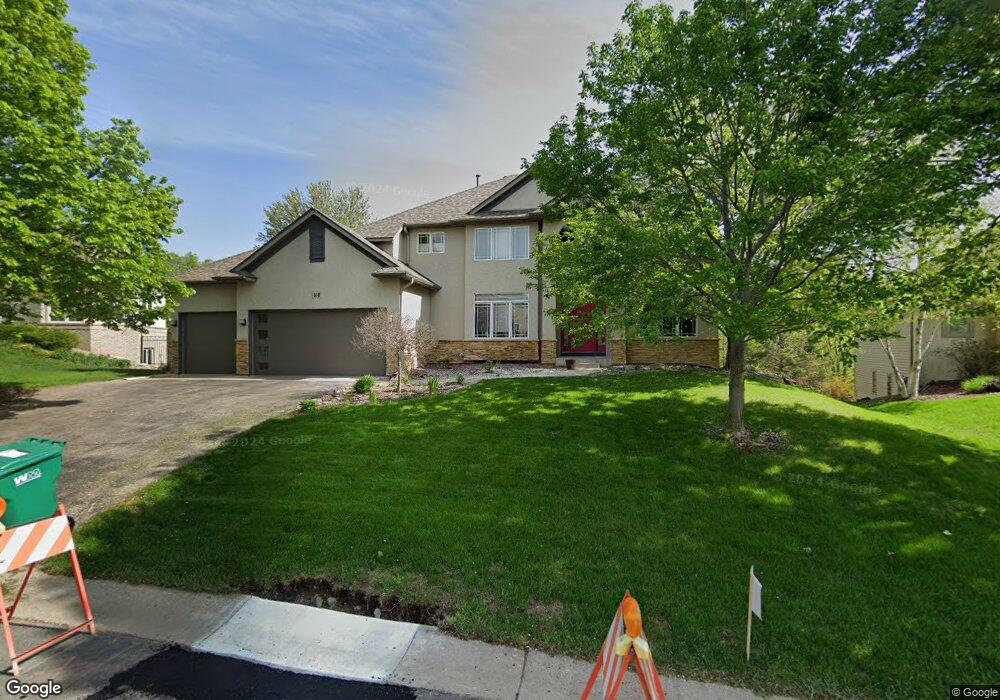
3918 Donegal Way Saint Paul, MN 55122
Estimated Value: $802,000 - $860,000
6
Beds
5
Baths
4,747
Sq Ft
$175/Sq Ft
Est. Value
About This Home
This home is located at 3918 Donegal Way, Saint Paul, MN 55122 and is currently estimated at $832,727, approximately $175 per square foot. 3918 Donegal Way is a home located in Dakota County with nearby schools including Deerwood Elementary School, Black Hawk Middle School, and Eagan Senior High School.
Ownership History
Date
Name
Owned For
Owner Type
Purchase Details
Closed on
May 7, 2021
Sold by
Larson Kari L and Larson Bruce
Bought by
Satrijo Andrew and Palaima Elizabeth
Current Estimated Value
Home Financials for this Owner
Home Financials are based on the most recent Mortgage that was taken out on this home.
Original Mortgage
$548,250
Outstanding Balance
$415,073
Interest Rate
3.1%
Mortgage Type
New Conventional
Estimated Equity
$417,654
Purchase Details
Closed on
Oct 20, 2011
Sold by
Mehrota Ravi and Mehrota Yasmin
Bought by
Larson Bruce and Larson Kari L
Home Financials for this Owner
Home Financials are based on the most recent Mortgage that was taken out on this home.
Original Mortgage
$44,900
Interest Rate
3.27%
Mortgage Type
Credit Line Revolving
Purchase Details
Closed on
Sep 14, 1998
Sold by
R A Kot Homes Inc
Bought by
Mehrotra Yasmin and Mehrotra Ravi
Purchase Details
Closed on
Jan 5, 1998
Sold by
Murphy Farm Lp
Bought by
Ra Kot Homes
Create a Home Valuation Report for This Property
The Home Valuation Report is an in-depth analysis detailing your home's value as well as a comparison with similar homes in the area
Home Values in the Area
Average Home Value in this Area
Purchase History
| Date | Buyer | Sale Price | Title Company |
|---|---|---|---|
| Satrijo Andrew | $710,000 | Dca Title | |
| Larson Bruce | $450,000 | Title Recording Services | |
| Mehrotra Yasmin | $432,175 | -- | |
| Ra Kot Homes | $393,500 | -- |
Source: Public Records
Mortgage History
| Date | Status | Borrower | Loan Amount |
|---|---|---|---|
| Open | Satrijo Andrew | $548,250 | |
| Previous Owner | Larson Bruce | $44,900 | |
| Previous Owner | Larson Bruce | $360,000 |
Source: Public Records
Tax History Compared to Growth
Tax History
| Year | Tax Paid | Tax Assessment Tax Assessment Total Assessment is a certain percentage of the fair market value that is determined by local assessors to be the total taxable value of land and additions on the property. | Land | Improvement |
|---|---|---|---|---|
| 2024 | $8,956 | $788,700 | $234,500 | $554,200 |
| 2023 | $8,956 | $754,900 | $235,200 | $519,700 |
| 2022 | $7,938 | $772,100 | $252,800 | $519,300 |
| 2021 | $7,572 | $674,500 | $219,800 | $454,700 |
| 2020 | $7,614 | $633,200 | $209,400 | $423,800 |
| 2019 | $7,050 | $621,700 | $199,400 | $422,300 |
| 2018 | $6,918 | $606,800 | $189,900 | $416,900 |
| 2017 | $7,414 | $579,900 | $180,900 | $399,000 |
| 2016 | $7,598 | $590,400 | $172,300 | $418,100 |
| 2015 | $7,027 | $598,400 | $172,300 | $426,100 |
| 2014 | -- | $567,400 | $167,600 | $399,800 |
| 2013 | -- | $524,200 | $152,100 | $372,100 |
Source: Public Records
Map
Nearby Homes
- 3933 Donegal Way
- 3958 Riverton Ave
- 1630 Murphy Pkwy
- 1769 Serpentine Dr
- 3778 Grey Dove Ln
- 1781 Taconite Point
- 1730 Flamingo Dr
- 1680 Oakbrooke Ct
- 3770 Robin Ln
- 1536 Stonewood Ln
- 3847 Lodestone Cir
- 4100 Meadowlark Ln
- 1651 Blackhawk Cove
- 1753 Bluebill Dr
- 3907 Mica Trail
- 3703 Blackhawk Lake Ct
- 1855 Silver Bell Rd Unit 314
- 1855 Silver Bell Rd Unit 120
- 3681 Robin Ln
- 1871 Silver Bell Rd Unit 217
- 3922 Donegal Way
- 3914 Donegal Way
- 3910 Donegal Way
- 3929 Donegal Way
- 3925 Donegal Way
- 3926 Donegal Way
- 3930 Donegal Way
- 3906 Donegal Way
- 1627 Harbour Point
- 1689 Galway Ln
- 3917 Donegal Way
- 1685 Galway Ln
- 3900 Donegal Way
- 1623 Harbour Point
- 3913 Donegal Way
- 1693 Galway Ln
- 3940 Donegal Way
- 1619 Harbour Point
- 1697 Galway Ln
- 3900 Riverton Ave