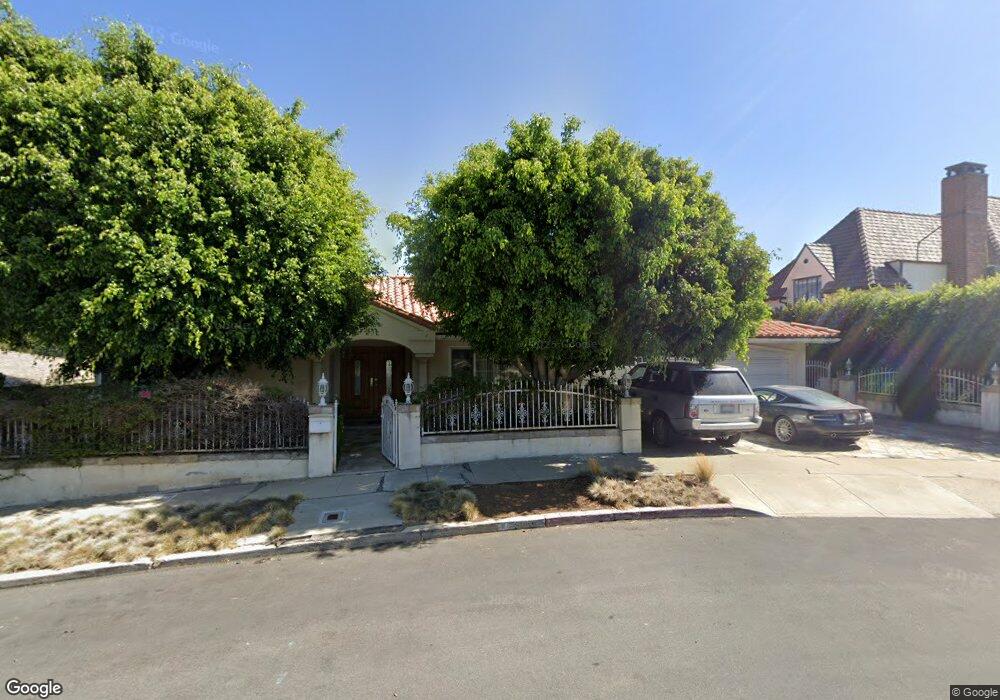
392 Norcroft Ave Los Angeles, CA 90024
Westwood NeighborhoodEstimated Value: $3,461,000 - $4,894,000
4
Beds
3
Baths
3,020
Sq Ft
$1,368/Sq Ft
Est. Value
About This Home
This home is located at 392 Norcroft Ave, Los Angeles, CA 90024 and is currently estimated at $4,131,038, approximately $1,367 per square foot. 392 Norcroft Ave is a home located in Los Angeles County with nearby schools including Warner Avenue Elementary, Ralph Waldo Emerson Community Charter Middle School, and University High School Charter.
Ownership History
Date
Name
Owned For
Owner Type
Purchase Details
Closed on
Mar 14, 2016
Sold by
Esfandi Jennifer
Bought by
Esfandi Jennifer and The Ffme Trust
Current Estimated Value
Purchase Details
Closed on
Aug 3, 2015
Sold by
Esfandi Rashel
Bought by
Esfandi Jennifer
Purchase Details
Closed on
Oct 1, 2009
Sold by
Esfandi Rashel
Bought by
Esfandi Rashel and Trust A
Purchase Details
Closed on
Jun 22, 2009
Sold by
Rela Llc
Bought by
Esfandi Rashel
Purchase Details
Closed on
Jan 14, 2009
Sold by
Esfandi Rashel
Bought by
Rela Llc
Purchase Details
Closed on
Mar 7, 2004
Sold by
Esfandi Rashel and The Esfandi Revocable Family T
Bought by
Esfandi Rashel
Home Financials for this Owner
Home Financials are based on the most recent Mortgage that was taken out on this home.
Original Mortgage
$456,500
Interest Rate
5.77%
Mortgage Type
New Conventional
Purchase Details
Closed on
Jul 29, 1999
Sold by
Esfandi Edward J and Esfandi Rashel
Bought by
Esfandi Edward J and Esfandi Rashel
Create a Home Valuation Report for This Property
The Home Valuation Report is an in-depth analysis detailing your home's value as well as a comparison with similar homes in the area
Home Values in the Area
Average Home Value in this Area
Purchase History
| Date | Buyer | Sale Price | Title Company |
|---|---|---|---|
| Esfandi Jennifer | -- | None Available | |
| Esfandi Jennifer | -- | None Available | |
| Esfandi Rashel | -- | None Available | |
| Esfandi Rashel | -- | None Available | |
| Esfandi Rashel | -- | None Available | |
| Rela Llc | -- | None Available | |
| Esfandi Rashel | -- | Diversified Title | |
| Esfandi Edward J | -- | -- |
Source: Public Records
Mortgage History
| Date | Status | Borrower | Loan Amount |
|---|---|---|---|
| Previous Owner | Esfandi Rashel | $456,500 |
Source: Public Records
Tax History Compared to Growth
Tax History
| Year | Tax Paid | Tax Assessment Tax Assessment Total Assessment is a certain percentage of the fair market value that is determined by local assessors to be the total taxable value of land and additions on the property. | Land | Improvement |
|---|---|---|---|---|
| 2025 | $23,158 | $1,931,296 | $1,252,965 | $678,331 |
| 2024 | $23,158 | $1,893,429 | $1,228,398 | $665,031 |
| 2023 | $22,711 | $1,856,304 | $1,204,312 | $651,992 |
| 2022 | $21,657 | $1,819,907 | $1,180,699 | $639,208 |
| 2021 | $21,388 | $1,784,224 | $1,157,549 | $626,675 |
| 2019 | $20,746 | $1,731,305 | $1,123,216 | $608,089 |
| 2018 | $20,625 | $1,697,359 | $1,101,193 | $596,166 |
| 2016 | $9,730 | $792,988 | $430,734 | $362,254 |
| 2015 | $9,589 | $781,077 | $424,264 | $356,813 |
| 2014 | $9,624 | $765,778 | $415,954 | $349,824 |
Source: Public Records
Map
Nearby Homes
- 365 Norcroft Ave
- 453 Dalehurst Ave
- 365 Comstock Ave
- 10444 Charing Cross Rd
- 547 Loring Ave
- 601 Woodruff Ave
- 570 S Beverly Glen Blvd
- 10386 Strathmore Dr
- 570 S Mapleton Dr
- 101 Bel Air Rd
- 740 Warner Ave
- 200 S Mapleton Dr
- 820 Glenmont Ave
- 10301 Strathmore Dr
- 133 S Mapleton Dr
- 107 Delfern Dr
- 235 St Pierre Rd
- 850 Thayer Ave
- 259 St Pierre Rd
- 850 Birchwood Dr
- 10557 Wyton Dr
- 384 Norcroft Ave
- 393 Dalehurst Ave
- 383 Dalehurst Ave
- 431 Dalehurst Ave
- 10551 Wyton Dr
- 435 Dalehurst Ave
- 10560 Wyton Dr
- 10545 Wyton Dr
- 370 Norcroft Ave
- 10570 Wyton Dr
- 441 Dalehurst Ave
- 10575 Wyton Dr
- 376 Dalehurst Ave
- 10581 Wyton Dr
- 10541 Wyton Dr
- 10544 Wyton Dr
- 447 Dalehurst Ave
- 400 Hilgard Ave
- 414 Hilgard Ave