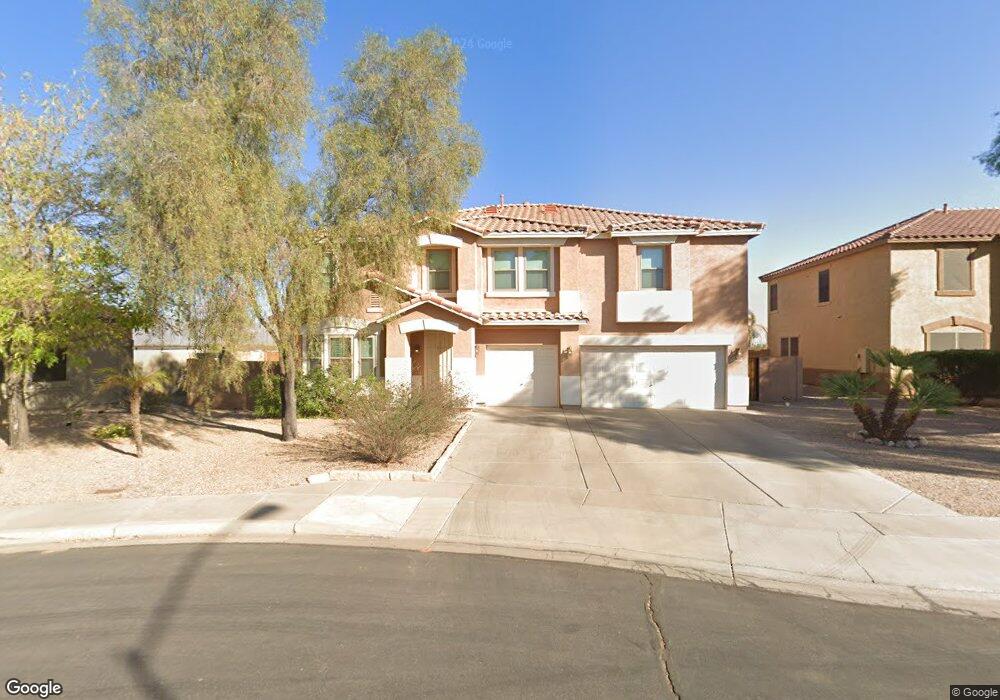
3921 S Adelle Mesa, AZ 85212
Superstition Vistas NeighborhoodEstimated Value: $635,853 - $662,000
5
Beds
3
Baths
3,691
Sq Ft
$176/Sq Ft
Est. Value
About This Home
This home is located at 3921 S Adelle, Mesa, AZ 85212 and is currently estimated at $649,713, approximately $176 per square foot. 3921 S Adelle is a home located in Maricopa County with nearby schools including Desert Ridge Jr. High School, Desert Ridge High School, and Great Hearts Blossom Rock.
Ownership History
Date
Name
Owned For
Owner Type
Purchase Details
Closed on
Oct 15, 2018
Sold by
Bays Mcgary A and Bays Sunny C
Bought by
Bays Mcgary Alan and Bays Sunny Christina
Current Estimated Value
Purchase Details
Closed on
Jan 30, 2009
Sold by
U S Bank National Association
Bought by
Bays Mcgary A and Bays Sunny C
Home Financials for this Owner
Home Financials are based on the most recent Mortgage that was taken out on this home.
Original Mortgage
$236,700
Outstanding Balance
$148,176
Interest Rate
4.92%
Mortgage Type
Purchase Money Mortgage
Estimated Equity
$501,537
Purchase Details
Closed on
Aug 18, 2008
Sold by
Mccallister Michael S and Mccallister Lori D
Bought by
U S Bank Na
Purchase Details
Closed on
Aug 23, 2001
Sold by
Kb Home Phoenix Inc
Bought by
Kb Home Sales Phoenix Inc and Kaufman & Broad Home Sales Arizona Inc
Create a Home Valuation Report for This Property
The Home Valuation Report is an in-depth analysis detailing your home's value as well as a comparison with similar homes in the area
Home Values in the Area
Average Home Value in this Area
Purchase History
| Date | Buyer | Sale Price | Title Company |
|---|---|---|---|
| Bays Mcgary Alan | -- | None Available | |
| Bays Mcgary A | $263,000 | Accommodation | |
| U S Bank Na | $252,523 | None Available | |
| Kb Home Sales Phoenix Inc | -- | -- |
Source: Public Records
Mortgage History
| Date | Status | Borrower | Loan Amount |
|---|---|---|---|
| Open | Bays Mcgary A | $236,700 |
Source: Public Records
Tax History
| Year | Tax Paid | Tax Assessment Tax Assessment Total Assessment is a certain percentage of the fair market value that is determined by local assessors to be the total taxable value of land and additions on the property. | Land | Improvement |
|---|---|---|---|---|
| 2025 | $2,211 | $29,857 | -- | -- |
| 2024 | $2,146 | $28,436 | -- | -- |
| 2023 | $2,146 | $49,710 | $9,940 | $39,770 |
| 2022 | $2,093 | $36,220 | $7,240 | $28,980 |
| 2021 | $2,267 | $31,880 | $6,370 | $25,510 |
| 2020 | $2,228 | $30,210 | $6,040 | $24,170 |
| 2019 | $2,065 | $27,530 | $5,500 | $22,030 |
| 2018 | $1,965 | $25,900 | $5,180 | $20,720 |
| 2017 | $1,904 | $24,500 | $4,900 | $19,600 |
| 2016 | $1,974 | $24,700 | $4,940 | $19,760 |
| 2015 | $1,811 | $23,130 | $4,620 | $18,510 |
Source: Public Records
Map
Nearby Homes
- 11533 E Quicksilver Ave
- 11322 E Rembrandt Ave
- 11223 E Raleigh Ave Unit 3
- 3549 S Oxley Cir
- 11535 E Persimmon Ave
- 3529 S Tambor Unit 1
- 11430 E Pronghorn Ave Unit 3
- 11548 E Corbin Ave
- 4419 S Adelle
- 10903 E Quade Ave
- 11312 E Prairie Ave
- 10933 E Renfield Ave
- 11250 E Prairie Ave
- 11436 E Sonrisa Ave
- 4539 S Antonio
- 11441 E Sonrisa Ave
- 2305 W Starkey Dr
- 10830 E Ramona Ave
- 9080 S Hohokam Dr
- 11051 E Sebring Ave
- 3929 S Adelle Unit 4
- 11540 E Reuben Ave
- 11535 E Reuben Ave Unit 4
- 3937 S Adelle
- 11534 E Reuben Ave
- 11528 E Reuben Ave
- 11536 E Renata Ave
- 11529 E Reuben Ave
- 3945 S Adelle
- 11539 E Ramblewood Ave
- 11522 E Reuben Ave
- 11528 E Renata Ave
- 11527 E Ramblewood Ave
- 11523 E Reuben Ave
- 11543 E Renata Ave
- 3859 S Adelle
- 11521 E Ramblewood Ave
- 11516 E Reuben Ave
- 11520 E Renata Ave
- 11537 E Renata Ave
Your Personal Tour Guide
Ask me questions while you tour the home.