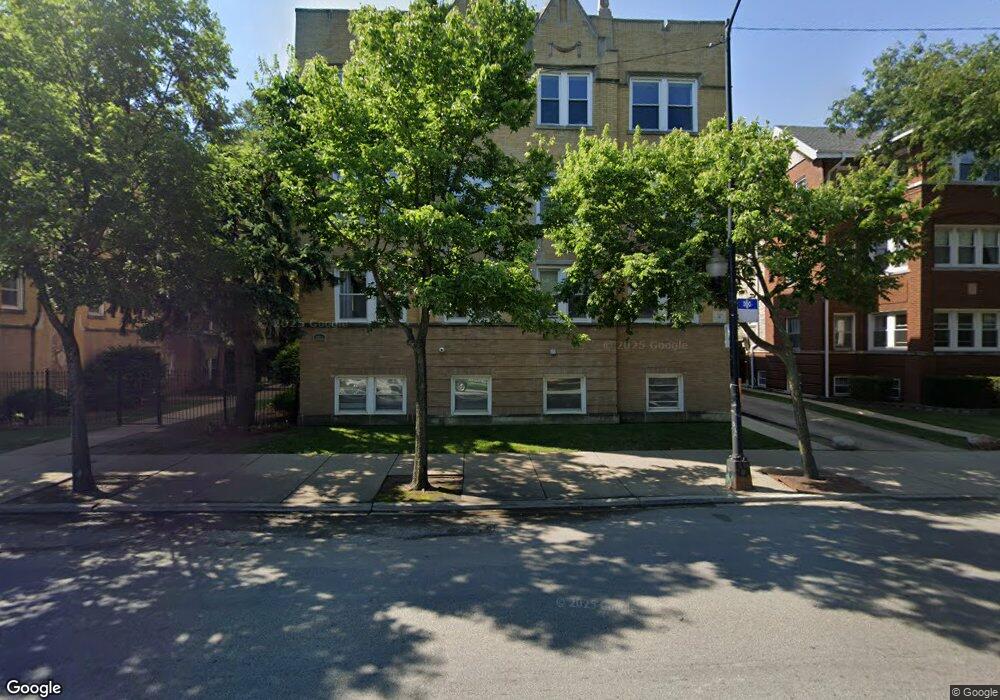
3921 W Addison St Unit 3921G Chicago, IL 60618
Avondale NeighborhoodEstimated Value: $294,000 - $381,000
--
Bed
--
Bath
--
Sq Ft
0.36
Acres
About This Home
This home is located at 3921 W Addison St Unit 3921G, Chicago, IL 60618 and is currently estimated at $332,772. 3921 W Addison St Unit 3921G is a home located in Cook County with nearby schools including Reilly Elementary School, Schurz High School, and ASPIRA Early College High School.
Ownership History
Date
Name
Owned For
Owner Type
Purchase Details
Closed on
Oct 18, 2024
Sold by
Ac Villas Llc
Bought by
Hudson-Casanova Michael and Rot Sarah
Current Estimated Value
Home Financials for this Owner
Home Financials are based on the most recent Mortgage that was taken out on this home.
Original Mortgage
$251,100
Outstanding Balance
$248,348
Interest Rate
6.13%
Mortgage Type
New Conventional
Estimated Equity
$84,424
Purchase Details
Closed on
Oct 14, 2021
Sold by
Craft Charles
Bought by
Ac Villas Llc
Purchase Details
Closed on
Jul 27, 2015
Sold by
Friday David A and Friday Ivonne
Bought by
Craft Charles
Purchase Details
Closed on
May 15, 2008
Sold by
European Heritage Villas & Development L
Bought by
Friday David and Rivera Ivonne Y
Home Financials for this Owner
Home Financials are based on the most recent Mortgage that was taken out on this home.
Original Mortgage
$237,500
Interest Rate
6.1%
Mortgage Type
Unknown
Create a Home Valuation Report for This Property
The Home Valuation Report is an in-depth analysis detailing your home's value as well as a comparison with similar homes in the area
Home Values in the Area
Average Home Value in this Area
Purchase History
| Date | Buyer | Sale Price | Title Company |
|---|---|---|---|
| Hudson-Casanova Michael | $270,000 | None Listed On Document | |
| Ac Villas Llc | $100,000 | Old Republic Title | |
| Craft Charles | $220,000 | Premier Title | |
| Friday David | $250,000 | First American Title |
Source: Public Records
Mortgage History
| Date | Status | Borrower | Loan Amount |
|---|---|---|---|
| Open | Hudson-Casanova Michael | $251,100 | |
| Previous Owner | Friday David | $237,500 |
Source: Public Records
Tax History Compared to Growth
Tax History
| Year | Tax Paid | Tax Assessment Tax Assessment Total Assessment is a certain percentage of the fair market value that is determined by local assessors to be the total taxable value of land and additions on the property. | Land | Improvement |
|---|---|---|---|---|
| 2024 | $7,199 | $35,041 | $4,846 | $30,195 |
| 2023 | $7,017 | $34,000 | $3,899 | $30,101 |
| 2022 | $7,017 | $34,000 | $3,899 | $30,101 |
| 2021 | $6,859 | $33,999 | $3,899 | $30,100 |
| 2020 | $5,139 | $22,986 | $1,782 | $21,204 |
| 2019 | $5,187 | $25,722 | $1,782 | $23,940 |
| 2018 | $5,081 | $25,722 | $1,782 | $23,940 |
| 2017 | $5,501 | $25,555 | $1,559 | $23,996 |
| 2016 | $4,015 | $25,555 | $1,559 | $23,996 |
| 2015 | $3,859 | $25,555 | $1,559 | $23,996 |
| 2014 | $3,447 | $21,149 | $1,336 | $19,813 |
| 2013 | -- | $21,149 | $1,336 | $19,813 |
Source: Public Records
Map
Nearby Homes
- 3904 W Eddy St
- 4012 W Eddy St
- 3622 N Avers Ave
- 3453 N Harding Ave
- 3614 N Hamlin Ave
- 4028 W Waveland Ave
- 3643 N Hamlin Ave
- 3429 N Avers Ave
- 3438 N Hamlin Ave Unit 3A
- 4028 W Roscoe St
- 3737 W Cornelia Ave
- 3718 W Addison St
- 2848-50 N Ridgeway Ave
- 3721 W Eddy St
- 4160 W Eddy St
- 3457 N Ridgeway Ave
- 3524 N Lawndale Ave Unit 1
- 4170 W Cornelia Ave
- 3506 N Keeler Ave
- 4134 W Roscoe St
- 3921 W Addison St Unit 39213A
- 3921 W Addison St Unit 39211A
- 3921 W Addison St Unit 39213B
- 3921 W Addison St Unit 39113B
- 3921 W Addison St Unit 39113A
- 3921 W Addison St Unit 39212A
- 3921 W Addison St Unit 39212B
- 3921 W Addison St Unit 39211B
- 3921 W Addison St Unit 3A
- 3921 W Addison St Unit 3-B
- 3921 W Addison St Unit 2A
- 3921 W Addison St Unit 2-B
- 3921 W Addison St Unit 1C
- 3921 W Addison St Unit 1A
- 3921 W Addison St Unit 1-B
- 3921 W Addison St Unit 1N
- 3917 W Addison St Unit 39172C
- 3917 W Addison St Unit 39171C
- 3917 W Addison St Unit 39173C
- 3917 W Addison St Unit 2C